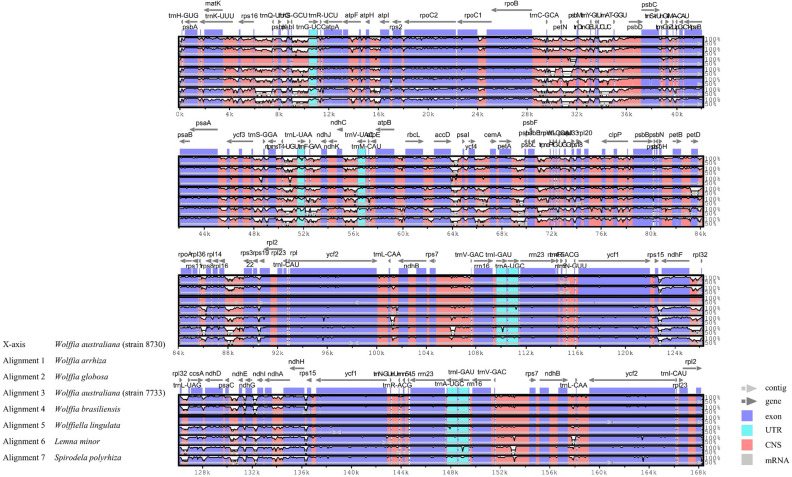
Figure 5.
Analyzed the chloroplast genome sequences of seven Lemnoideae species, including Wolffia arrhiza, using mVista, with Wolffia australiana as the reference. The X-axis represents the coordinates of the chloroplast genome sequence position, while the Y-axis indicates the range of sequence identity from 50 to 100%. The direction and position of the genes are depicted by the gray arrows on the graph. The graph's shaded colors have the following meanings: the dark blue regions correspond to protein coding sequences (CDS), the pink regions represent Conserved Non-Coding Sequences (CNS), and the light-blue regions indicate UTRs.

