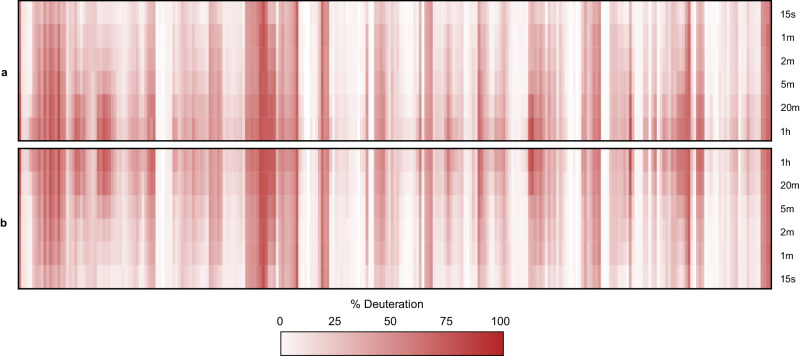
Fig. 6. Comparison of manual MS1 and AutoHX-derived deuteration values.
Data represents a 6-timepoint deuteration kinetics analysis of Phosphorylase B with all 380 peptide uptake plots shown as a heatmap ordered by sequence position. a AutoHX-derived deuteration values as described in the text. b MS1-derived deuteration values. A minimum of three useful fragments per peptide shared across all replicates and timepoints was set as a requirement for a peptide to be accepted.

