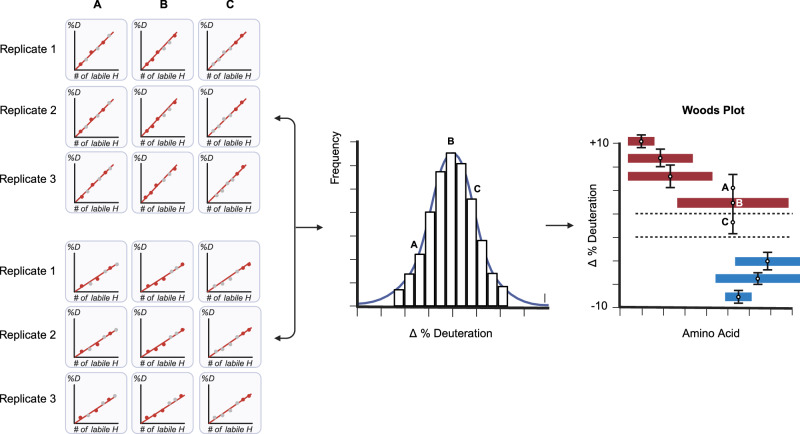
Fig. 7. Data combination applied to differential analysis.
Deuteration difference values between two states calculated from all possible data combinations (illustrated as A, B, and C) are used to generate a deuteration difference value distribution. This establishes a sampling precision for any measured change and facilitates data interpretation. Red represents induced destabilizations and blue induced stabilizations. The mean of the distribution is selected as the reported deuteration value, and the error bars represent two standard deviations (user selectable).

