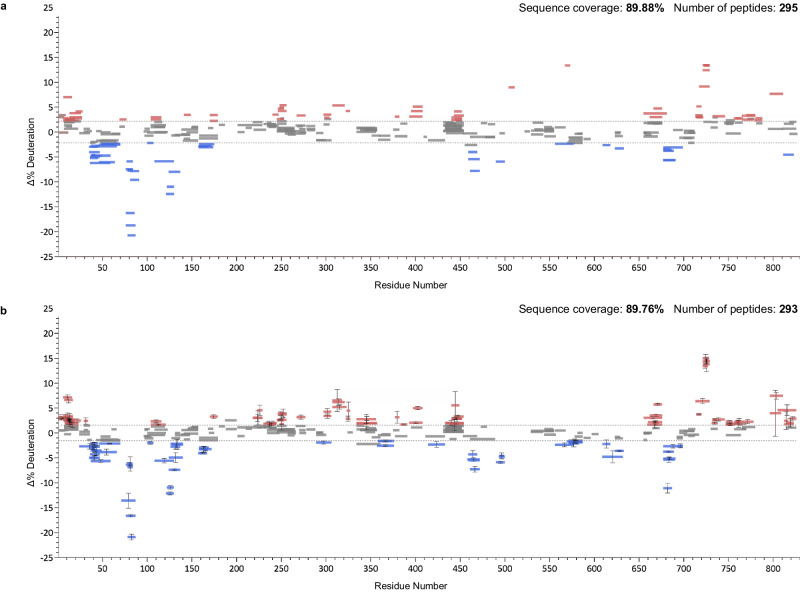
Fig. 8. Directly comparing manual and automated analysis.
a Woods plot produced through expert manual curation of MS1 data. b Automated generation of Woods plot in AutoHX using both MS1 and MS2 data. Data compares novobiocin-bound Pol ϴ to free Pol ϴ. Residue numbering is based on pdb:5AGA. Red represents induced destabilizations and blue induced stabilizations. Data generated from n = 3 biologically independent samples for each of the two states and the error bars represent ± two standard deviations.

