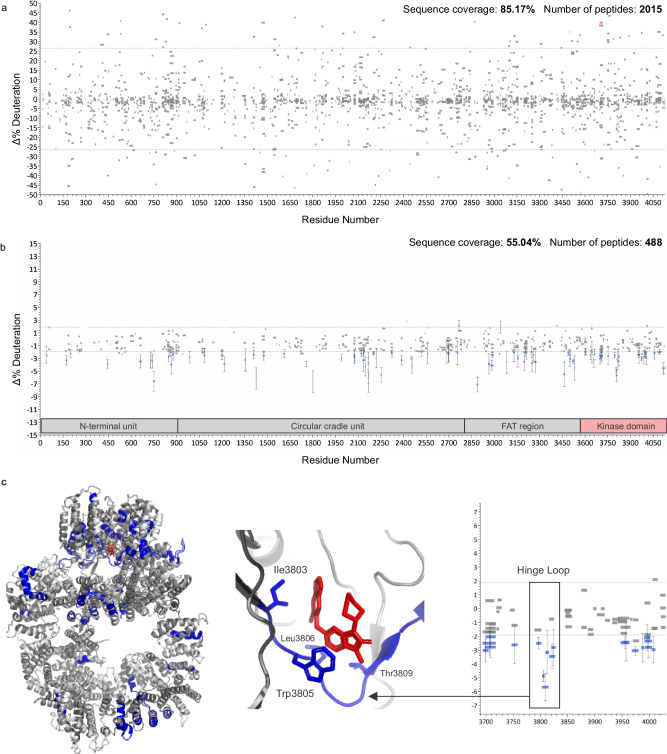
Fig. 9. Accelerated HX-MS analysis of DNA-PKcs isolated from low quantities of CHO cells.
a Unfiltered mapping file was blindly used for the generation of a Woods plot from replicate AZD7648-bound DNA-PKcs compared to a ligand-free control state. b Corresponding Woods plot produced using AutoHX without manual curation. c Mapping of high confidence stabilizations to PBB 7OTW, with expansion showing the highlighted hinge loop that defines the binding site. Key residues labeled as per Liang et al.42, where blue residues represent stabilization, dark gray no change and light gray no coverage. Data generated from n = 3 biologically independent samples for each of the two states and the error bars represent ± two standard deviations.

