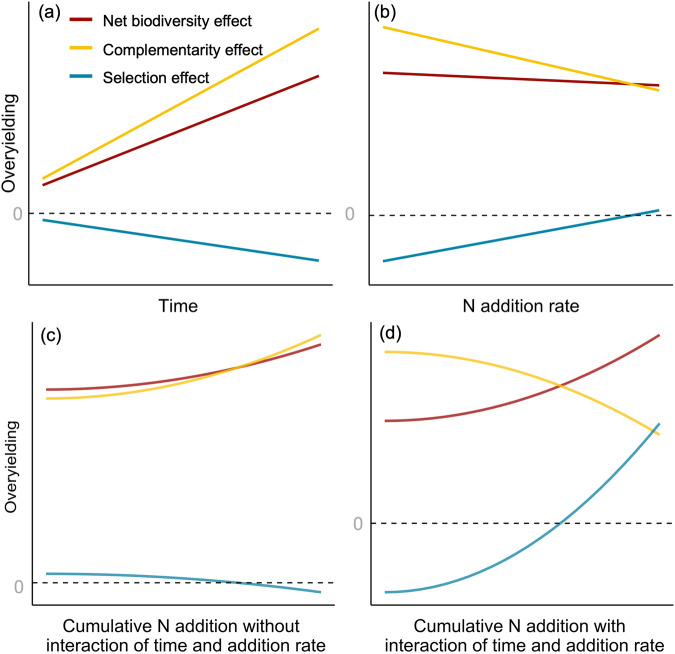
Fig. 1. Conceptual figure about potential changes of overyielding and its components with cumulative nitrogen addition.
Potential changes in net biodiversity effect, complementarity effect and selection effect with (a) time (without N addition; unit-year); (b) N addition rate (unit-kg/ha/year); (c) cumulative N addition (the total amount of N added across years; unit-kg/ha), when the effects of time and N addition rates are additive, these patterns without an interaction between the two effects were derived by multiplying the fitted trends in Fig. 1a, b; and (d) cumulative N addition, when the effects of time and N addition rates are multiplicative, these patterns with interaction between the two effects were derived by the fitted trend of multiplying data in Fig. 1a, b. Note that the x-axes are on the log scale for comparison with the results presented in this study.

