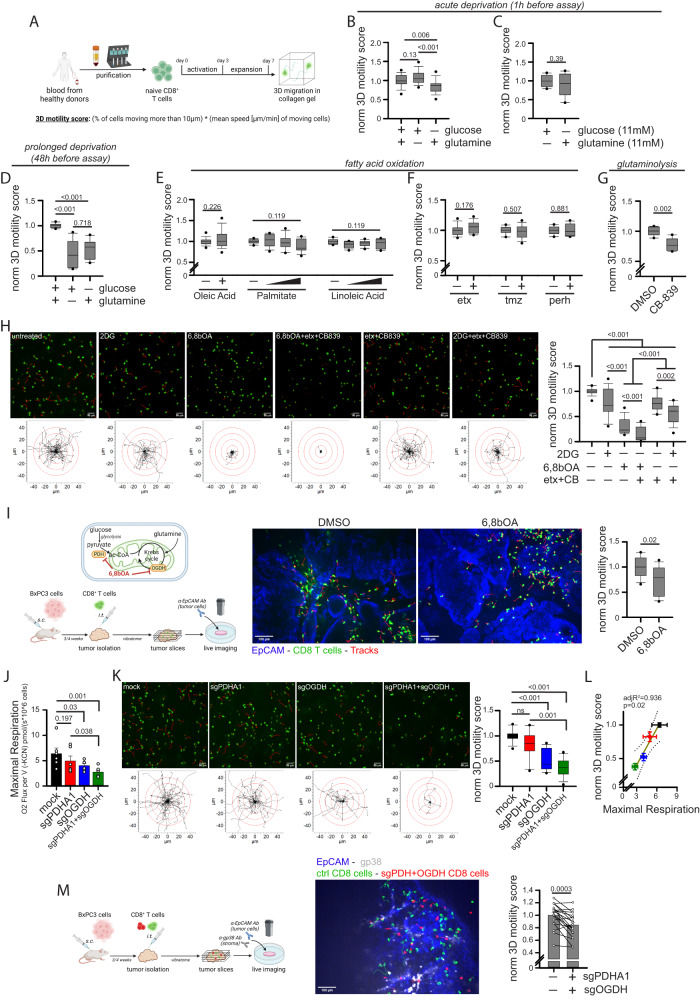
Fig. 1. CD8+ T cell 3D motility is mainly supported by the TCA cycle fueled by glucose and glutamine but not fatty acids.
A Experimental layout. B–H Normalized 3D motility Score of activated CD8+ T cells in a motility medium (see Methods) containing no glucose or no glutamine (B, n = 27 movies, One-Way ANOVA with posthoc Holm Sidak’s), either glucose or glutamine at 11 mM (C, n = 10 movies, unpaired two-tailed Student’s T-Test), starved from glucose or glutamine since 48 h before evaluating motility (D, n = 12 movies, ANOVA on Ranks with posthoc Tukey’s; also the motility assay was performed in the absence of glucose or glutamine) or in presence of the indicated nutrients or drugs (2DG: 2-deoxy-glucose; etx: etomoxir; tmz: trimetazidine; perh: perhexiline; 6,8bOA: 6,8-bis(benzylthio)octanoic acid; CB: CB-839) (E, oleic acid n = 29 movies [unpaired Student’s T-Test], linoleic acid & palmitate n = 12 movies [ANOVA on Ranks]; F, etx n = 12 movies, tmz & perh n = 10 movies [unpaired two-tailed Student’s T-Test]; G, n = 6 movies [unpaired two-tailed Student’s T-Test]; H, n = 18 movies [ANOVA on Ranks with posthoc Student–Newman–Keuls’s]). In (H), (top) 2D z-stack reconstructions of 3D motility in collagen gel (cells in green, tracks in red) and (bottom) superimposed tracks normalized to their starting coordinates (tracks in black, red circles every 10 µm) are shown for each condition. I Experimental layout (bottom) and enzymes inhibited by 6,8bOA (top) are shown on the left. 3D motility of Calcein Green-stained activated CD8+ T cells (cells in green, tracks in red) within viable tumor slice (tumor cells in blue, EpCAM) derived from the BxPC3/NSG model and incubated with the indicated drugs (n = 12 slices, unpaired two-tailed Student’s T-Test). J, L Measurement of maximal respiration (J, n = 6 biologically independent samples, One-Way ANOVA on Repeated Measurements with posthoc Holm Sidak’s) and normalized 3D motility Score (K, n = 15 movies, ANOVA on Ranks with posthoc Tukey’s) and correlation between the two parameters (L, Linear Regression Test from mean values of (J, K), linear regression mean ± 95% confidence interval are reported in yellow and gray, respectively) in activated CD8+ T cells CRISPR/Cas9-edited for the indicated genes. M Experimental layout on the left. 3D motility of activated Calcein Green-stained control CD8+ T cells (green) and Calcein Red-stained CRISPR/Cas9-edited CD8+ T cells (sgPDH+sgOGDH) (red) within viable tumor slice (tumor cells in blue, EpCAM; stroma in gray, gp38) derived from the BxPC3/NSG model (n = 19 slices, paired Student’s T-Test). Data are expressed as mean ± SEM in (J, L, M), and as box plot (center line, median; box limits, upper and lower quartiles; whiskers, 1.5x interquartile range; points, 5th and 95th percentiles) in (B–I, K). Scale bar, 50 µm in (H, K) and 100 µm in (I, M). Schemes in (A, I, M) have been created with BioRender.com.

