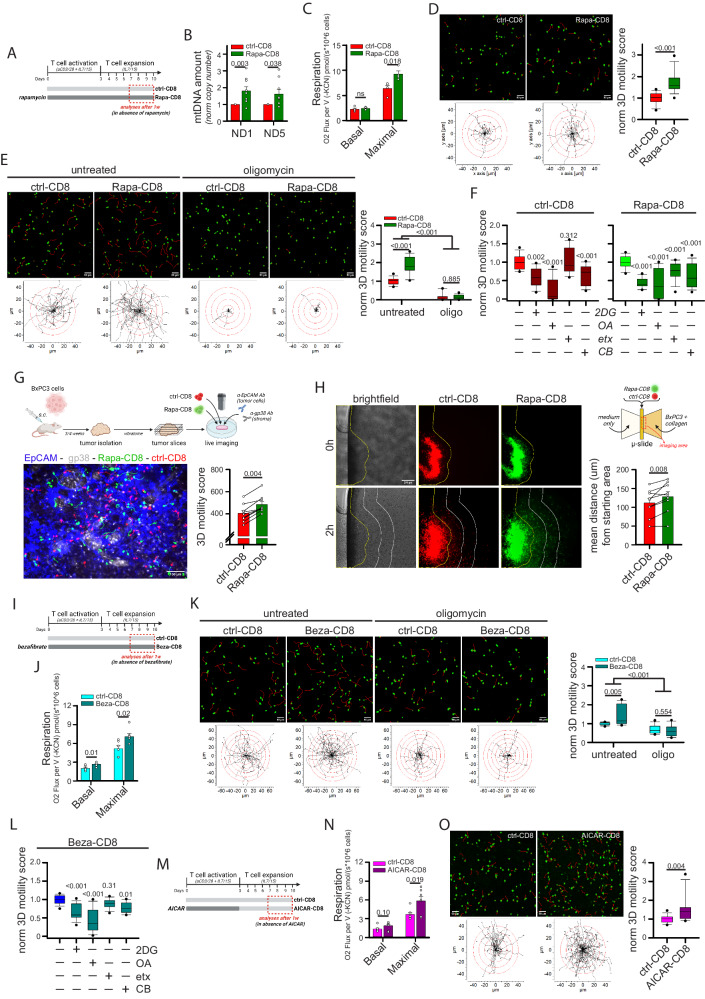
Fig. 5. Drugs promoting mitochondrial metabolism increase CD8+ T cell 3D motility.
A–F Experimental layout in A. CD8+ T cells have been cultured in ctrl condition (ctrl-CD8) or in the presence of rapamycin (Rapa-CD8). After 1w, rapamycin was removed the day of analysis and the following parameters were measured: mtDNA amount (normalized 2-ΔCt values between mtDNA genes ND1 or ND5 and nuclear gene 18 S; B, n = 9 independent biological samples, MW Rank Sum Test), basal and maximal respiration (C, n = 4 independent biological samples, unpaired two-tailed Student’s T-Test), normalized 3D motility Score in the presence or not of oligomycin (D, n = 30 movies, MW Rank Sum Test; E, n = 15 movies, ANOVA on Ranks with posthoc Student–Newman–Keuls’s). In (F), the relative 3D motility Score is reported after normalizing to 1 the mean score for both ctrl-CD8 and Rapa-CD8 cells (2DG: 2-deoxy-glucose, 6,8bOA: 6,8-bis(benzylthio)octanoic acid; etx: etomoxir; CB: CB-839) (ctrl-CD8, n = 12 movies and Rapa-CD8, n = 15 movies, ANOVA on Ranks with posthoc Student–Newman–Keuls’s). G Experimental layout on top. 3D motility of activated Calcein Green-stained ctrl-CD8 cells (shown in red for consistency) and Calcein Red-stained Rapa-CD8 cells (shown in green for consistency) overlaid onto viable tumor slices derived from the BxPC3/NSG model (tumor cells in blue, EpCAM; stroma in gray, gp38) (n = 9 slices, Wilcoxon paired Rank Sum Test). H Infiltration of Calcein Red-stained ctrl-CD8 cells (red) and Calcein Green-stained Rapa-CD8 cells (green) into a collagen solution containing human BxPC3 tumor cells (scheme on the top right, see Methods for details). Yellow lines identify starting position of cells at 0 h. White lines represent 200 µm increments. The mean distance from starting area for the two populations is reported in the graph (n = 9 slides, paired Student’s T-Test). I–L Experimental layout in (I). CD8+ T cells have been cultured in ctrl condition (ctrl-CD8) or in the presence of bezafibrate (Beza-CD8). After 1w, bezafibrate was removed and the following parameters were measured: basal and maximal respiration (J, n = 6 independent biological samples, unpaired two-tailed Student’s T-Test) and normalized 3D motility Score in the presence or not of oligomycin (K, n = 12 movies, ANOVA on Ranks with posthoc Student–Newman–Keuls’s). In (L) (n = 15 movies, ANOVA on Ranks with posthoc Dunnet’s), the relative 3D motility Score is reported after normalizing to 1 the mean score for untreated Beza-CD8 cells (as in F). M–O Experimental layout in (M). Activated CD8+ T cells have been cultured in ctrl condition (ctrl-CD8) or in the presence of AICAR (AICAR-CD8). After 3d, AICAR was removed, and the cells expanded in the control condition. The following parameters were measured starting from 7d: basal and maximal respiration (N, n = 7 independent biological samples, unpaired two-tailed Student’s T-Test) and normalized 3D motility Score (O, n = 15 movies, MW Rank Sum Test). Data are expressed as mean ± SEM in (B, C, G, H, J, N), and as box plot (center line, median; box limits, upper and lower quartiles; whiskers, 1.5x interquartile range; points, 5th and 95th percentiles) in (D–F, K, L, O). Scale bar, 50 µm in (D, E, K, O), 100 µm in (G) and 200 µm in (H). Schemes in (A, G, H, I, M) have been created with BioRender.com.

