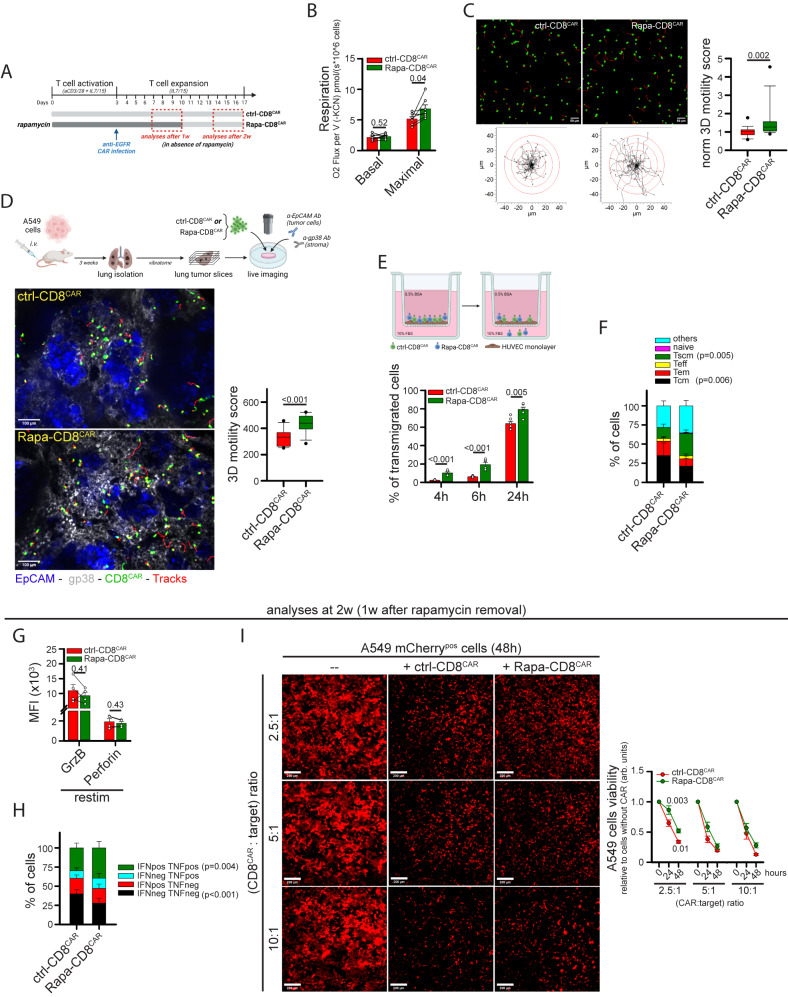
Fig. 6. Rapamycin treatment promotes intra-tumoral motility and transmigration in anti-EGFR CD8+ CAR T cells.
A Experimental layout. Anti-EGFR CD8+ CAR T cells were cultured in a control medium (ctrl-CD8CAR) or in the presence of rapamycin (Rapa-CD8CAR). All assays were performed in the absence of rapamycin. B, C Measurements of basal and maximal respiration (B, n = 7 independent biological samples, unpaired two-tailed Student’s t-Test) and normalized 3D motility Score (C, n = 18 movies, MW Rank Sum Test). D Experimental layout on top. 3D motility of activated Calcein Green-stained ctrl-CD8CAR and Rapa-CD8CAR cells (cells in green, tracks in red) overlaid onto viable lung tumor slices (tumor islets in blue, EpCAM; stroma in gray, gp38) derived from i.v. injection of A549 lung tumor cells into NSG mice (n = 12 slices, unpaired two-tailed Student’s t-Test). E Percentage of Calcein Green-stained ctrl-CD8CAR and eFluo670-stained Rapa-CD8CAR cells (mixed in a 1:1 ratio) that transmigrated across a TNF-activated HUVEC monolayer in a transwell system (n = 6 independent biological samples, Two-Way ANOVA with posthoc Holm Sidak’s). F Relative proportion of indicated T cell subsets in ctrl-CD8CAR and Rapa-CD8CAR cells (n = 4 independent biological samples, Two-Way ANOVA on repeated Measurements with posthoc Holm Sidak’s). G, H At 2 weeks (1 week after rapamycin removal) cells were restimulated for 5 h with human TransAct + BfdA. GranzymeB (GrzB) and Perforin levels (MFI) are indicated in G (n = 4 independent biological samples, unpaired two-tailed Student’s t-test). For IFNγ and TNF, the percentage of cells producing these cytokines is indicated in (H) (n = 4 independent biological samples, Two-Way ANOVA on Repeated Measurements with posthoc Holm Sidak’s). I Cytotoxicity of ctrl-CD8CAR and Rapa-CD8CAR cells against A549 (EGFR+ mCherry+) tumor cells 1 week after rapamycin removal. A549 cell viability was evaluated by measuring mCherry fluorescence (MFI) for each microscope field at the indicated time points (n = 12 microscope fields, Two-Way ANOVA with posthoc Holm Sidak’s for 2.5:1 and 10:1 ratio; ANOVA on Ranks with posthoc Tukey’s for 5:1 ratio). Data are expressed as mean ± SEM in (B, E–I), and as box plot (center line, median; box limits, upper and lower quartiles; whiskers, 1.5x interquartile range; points, 5th and 95th percentiles) in (C, D). Scale bar, 50 µm in (C), 100 µm in D and 200 µm in (I). Schemes in (A, D, E) have been created with BioRender.com.

