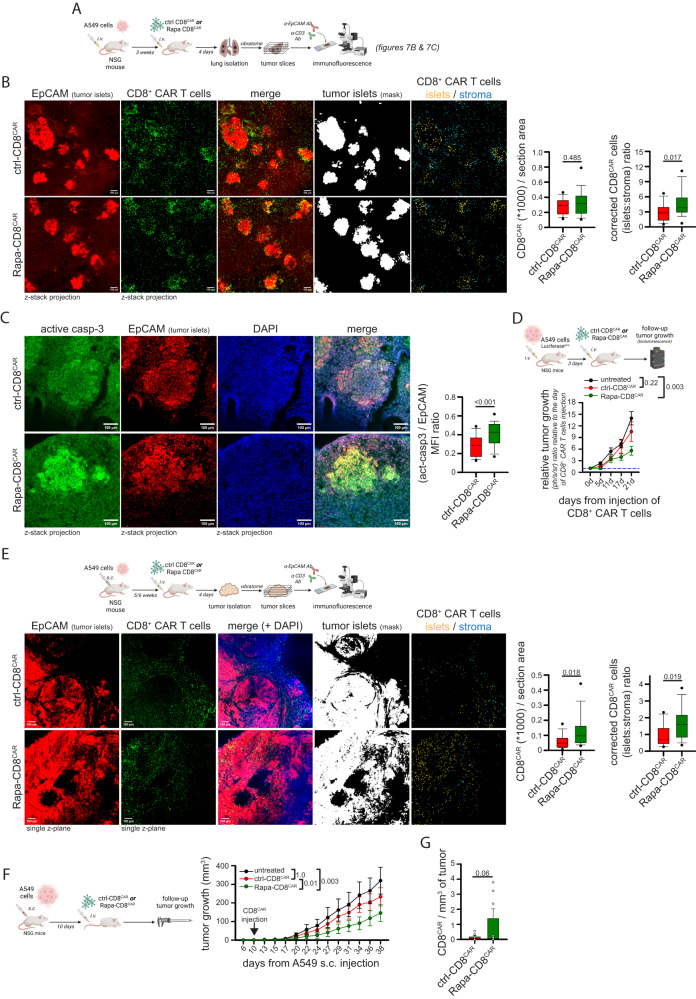
Fig. 7. Rapamycin-treated anti-EGFR CD8+ CAR T cells show enhanced infiltration and better tumor control in two different xenograft tumor models.
A–C Experimental layout in (A). In (B), representative immunofluorescence images of anti-EGFR ctrl-CD8CAR or Rapa-CD8CAR cells (anti-CD3 Ab, green) distribution in tumor islets and stroma (tumor cells identified using a EpCAM Ab, red) in each microscope field (ctrl-CD8CAR, n = 17 and Rapa-CD8CAR, n = 27 microscope fields, MW Rank Sum Test). An ImageJ mask was used to identify tumor islets (EpCAMpos), stroma (EpCAMneg) and CAR T cells. Graphs on the right report the total amount of CAR T cells per section area (left) and the relative [tumor islets/stroma] CAR T cell ratio (corrected for the [tumor islets/stroma] area ratio). In (C), immunofluorescence images of lung tumor slices stained for EpCAM (red) and active-caspase-3 (green). The graph on the right shows the relative [active-caspase-3/EpCAM] ratio for each tumor islet (ctrl-CD8CAR, n = 136 and Rapa-CD8CAR, n = 102 tumor islets from different microscope fields, MW Rank Sum Test). D Experimental layout on top. Measurement of tumor size by bioluminescence (normalized to value at day of CAR T cell injection) in mice bearing lung tumors (derived from Luciferasepos A549 cells i.v. injection 3 days before) untreated or infused with ctrl-CD8CAR or Rapa-CD8CAR cells (untreated, n = 6 mice; ctrl-CD8CAR, n = 8 mice; Rapa-CD8CAR, n = 8 mice, ANOVA on Ranks with posthoc Dunn’s). E Experimental layout on top. Images and graphs were prepared as in B (ctrl-CD8CAR, n = 18 and Rapa-CD8CAR, n = 14 microscope fields, MW Rank Sum Test for graph on the left; unpaired two-tailed Student’s T-Test for graph on the right) with the exception that an anti-CD45 Ab was used to identify CAR T cells. F, G Experimental layout on the left. Measurement of tumor size in A549-derived s.c. tumor-bearing mice untreated or infused with ctrl-CD8CAR or Rapa-CD8CAR cells (F; untreated, n = 7 mice; ctrl-CD8CAR, n = 8 mice; Rapa-CD8CAR, n = 8 mice, ANOVA on ranks with posthoc Dunn’s). Amount of CD8+ CAR T cells per mg of tumor at endpoint (38 days) (G; ctrl-CD8CAR, n = 8 and Rapa-CD8CAR, n = 7 mice, unpaired two-sided Student’s T-Test). Data are expressed as mean ± SEM in (D, F, G), and as box plot (center line, median; box limits, upper and lower quartiles; whiskers, 1.5x interquartile range; points, 5th and 95th percentiles) in (B, C, E). Scale bar, 100 µm in (B, C, E). Schemes in (A) and (D–F) have been created with BioRender.com.

