
FIGURE 5.
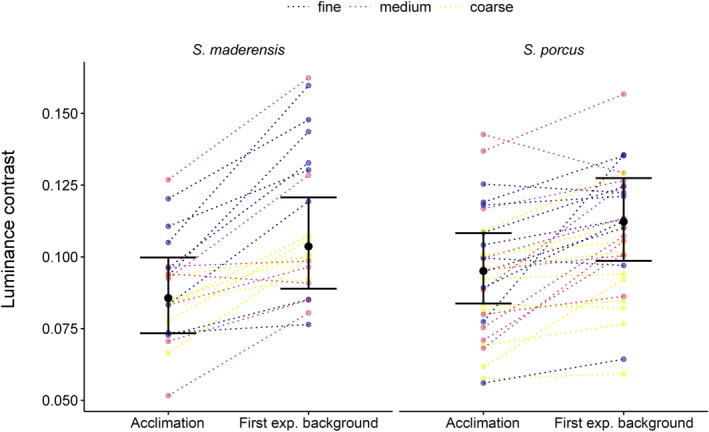
Fish change their pattern contrast between acclimation and the first experimental background. Contrast is given as the mean contrast value of edges based on the LEIA. The horizontal lines connect data points of an individual, colours indicate the background type used in the first experimental background. Points represent observations for each individual fish (N = 21 Scorpaena maderensis, N = 30 S. porcus). Markers with vertical bars represent predicted medians and 95% compatibility intervals (CIs) derived from 10,000 simulations of the posterior distribution of model parameters. The strength of the difference between two groups increases with decreasing degree of overlap of their 95% CIs.