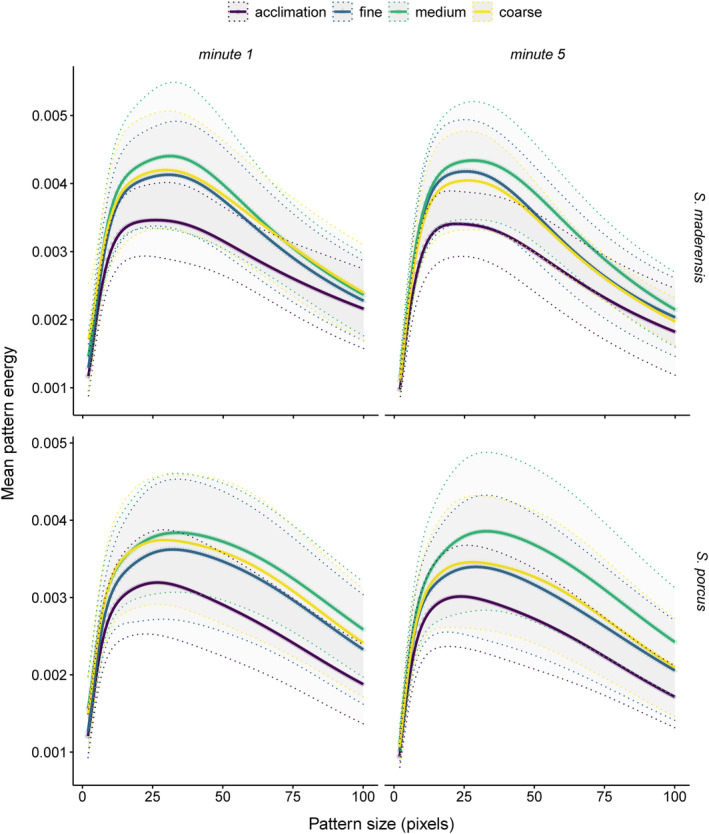
FIGURE A2.

Pattern energy spectra (pattern energy for each pattern size bin) of Scorpaena maderensis (n = 21) and S. porcus (n = 30) on the acclimation (uniform) and the three experimental backgrounds, split by the timepoint at which the measurement was taken (after 1 or 5 min). The thick lines indicate mean pattern energy, the dotted lines indicate its standard deviation. Pattern energy is defined as the standard deviation of the luminance channel's cone catches of the filtered pixels (see Section 2).
