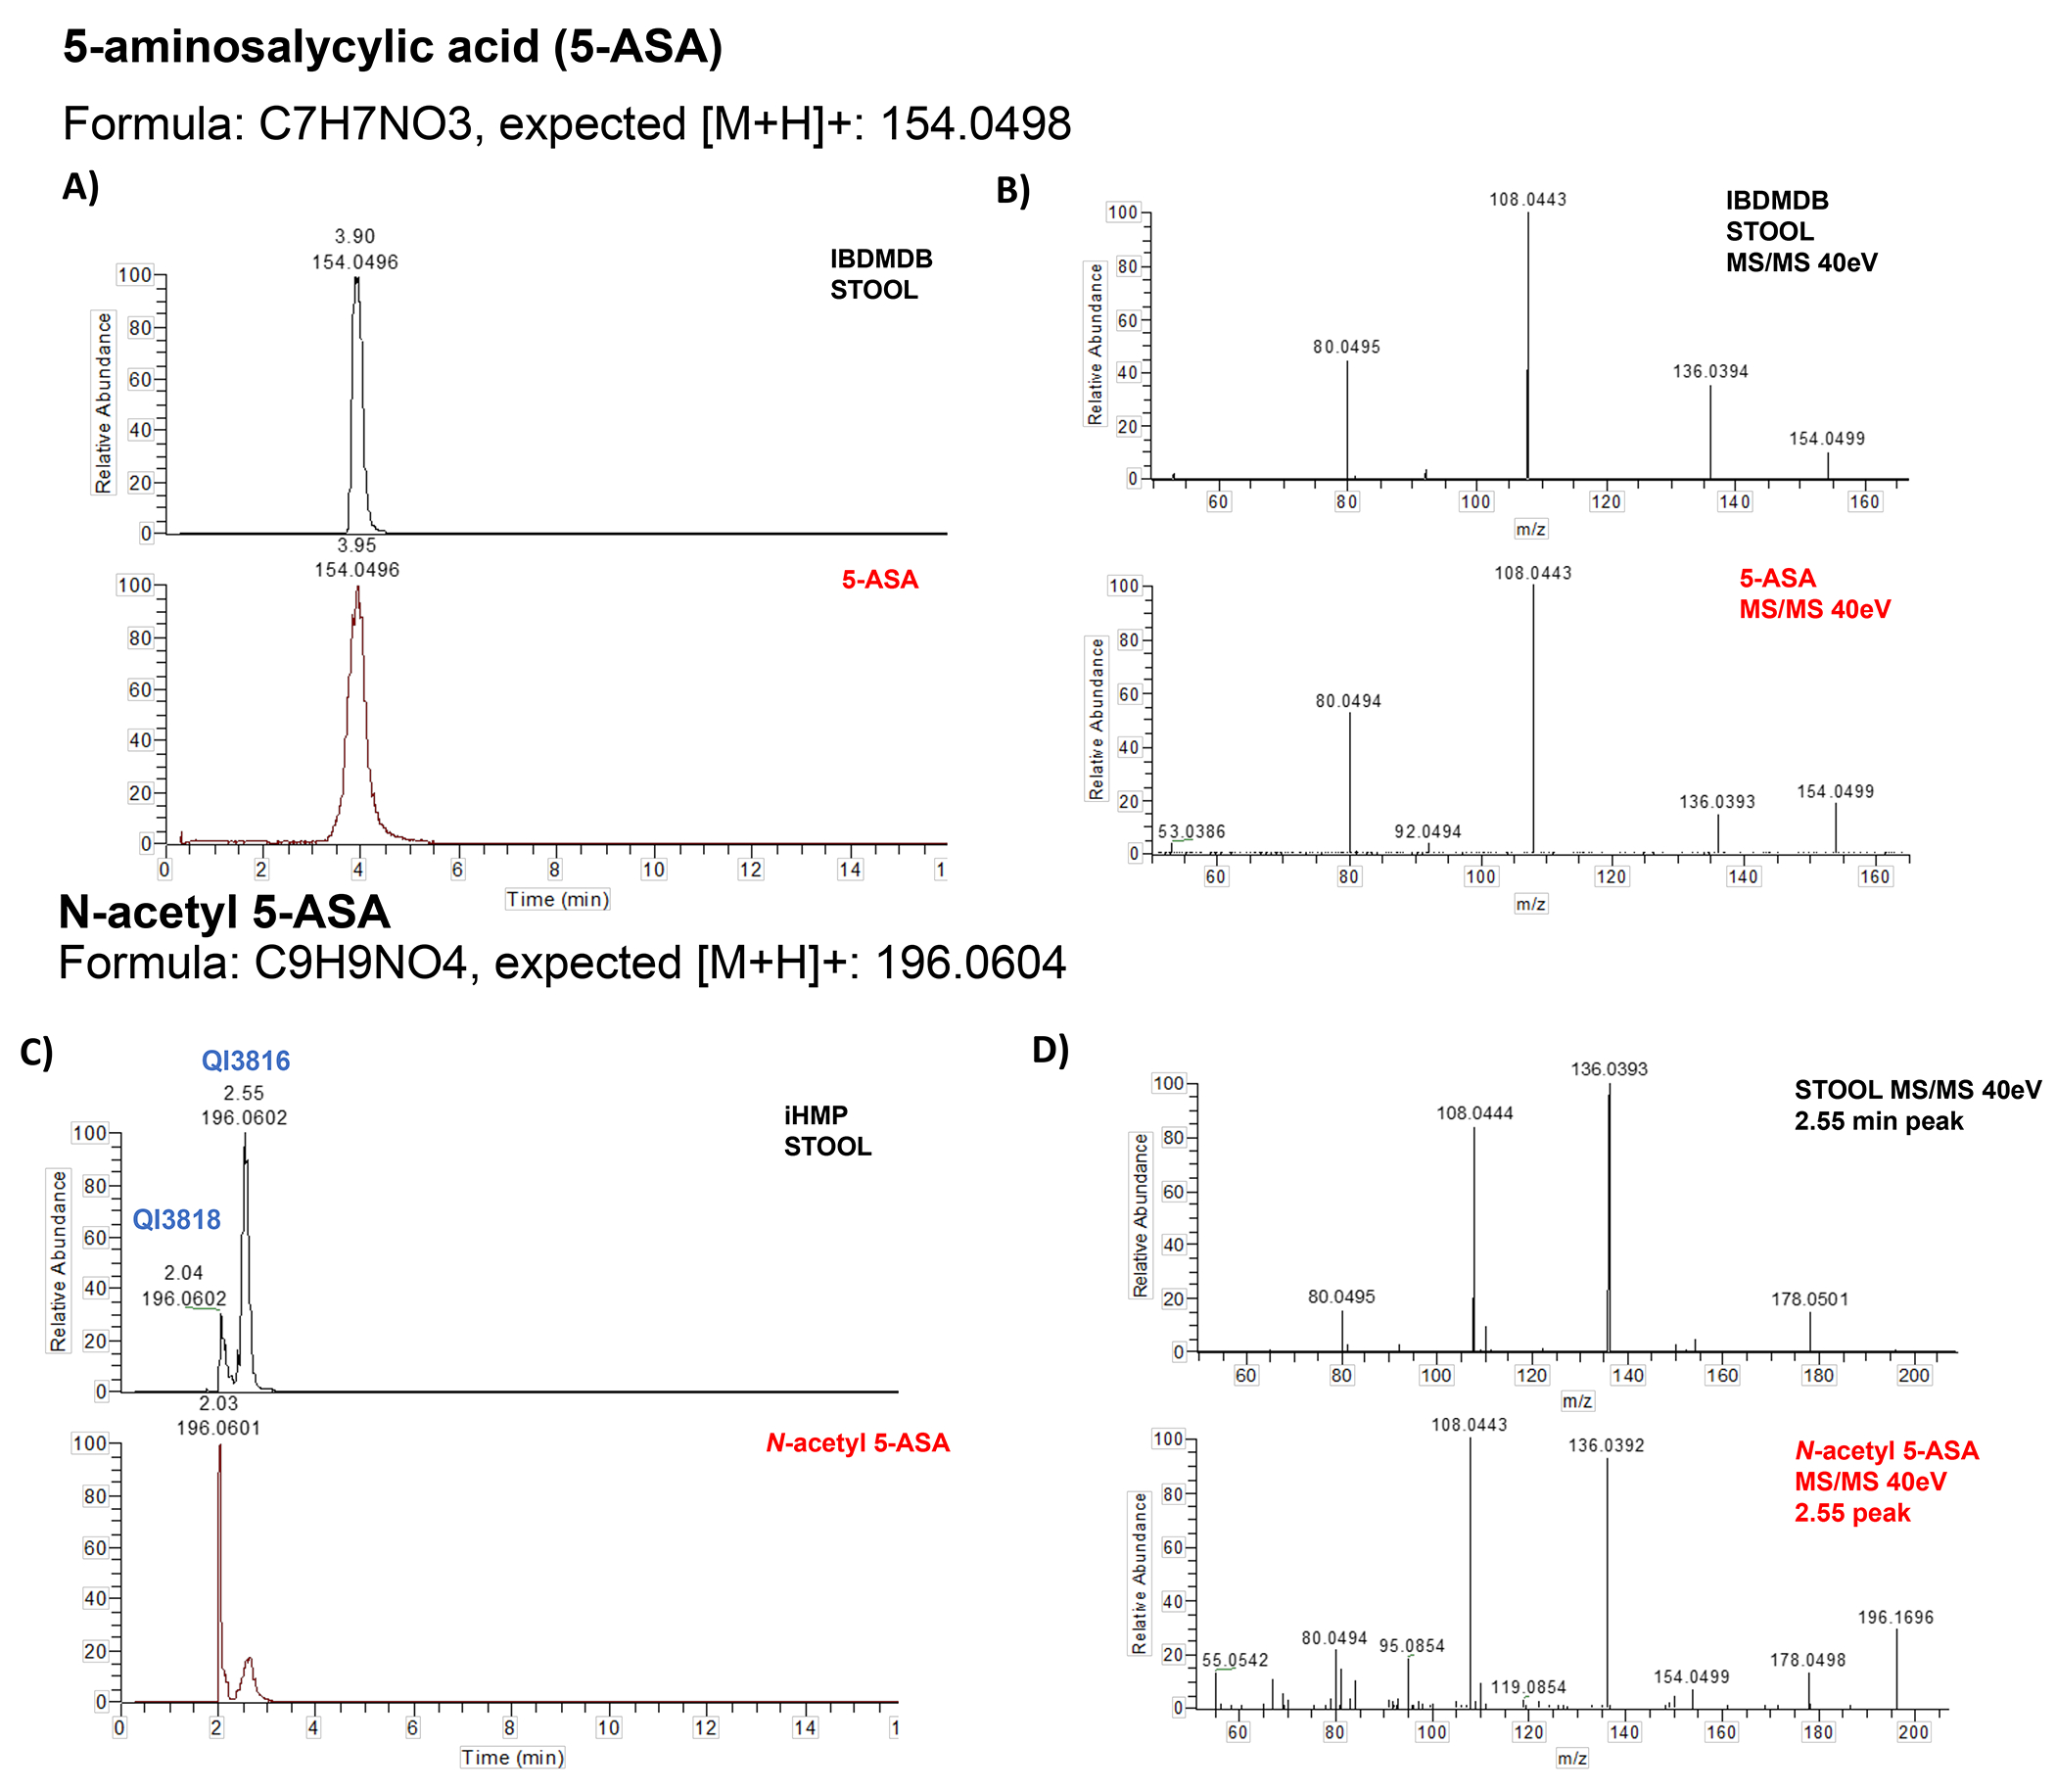
Extended Figure 10: Validity of 5-ASA and N-acetyl 5-ASA annotation by metabolomics methods.

Two separate standards for 5-ASA (SIGMA catalog PHR1060 and 18858) confirmed the identity of the 5-ASA peak in the IBDMDB (m/z: 154.0502, RT: 3.83 min) through retention time (panel A) and spectral matching (panel B). A standard for N-acetyl 5-ASA (Cayman Catalogue 27618) produced two peaks which matched two peaks in the IBDMDB (QI3818 and QI3816) (panel C). The later eluting peak (QI3816), was more abundant in the IBDMBD stool, correlated better with 5-ASA (Pearson’s correlation r=0.89 vs r=0.60), and had excellent MS/MS spectral matching (panel D). Further still, levels of QI3816 perfectly discriminate 5-ASA users from non-users (c-statistic 0.99).
