. 2024 Mar 11;12:RP91708. doi: 10.7554/eLife.91708

Figure 3. Fluorescence loss in photobleaching (FLIP) experiments monitor Golgi residence times of different proteins.

(A, C, E–G) Relative fluorescence intensity average time trace (mean ± standard error of the mean [s.e.m.]) of FLIP experiments for the indicated proteins. Symbols correspond to actual measurements, solid lines to the fitted exponential decays. (B, D) Residence time in the perinuclear area measured as the half time of the FLIP curves. Results are from 7 to 12 cells from each of n = 3 independent experiments (individual values shown, with mean ± stdev; ns, p > 0.05; **p ≤ 0.01; ***p ≤ 0.001; ****p ≤ 0.0001).

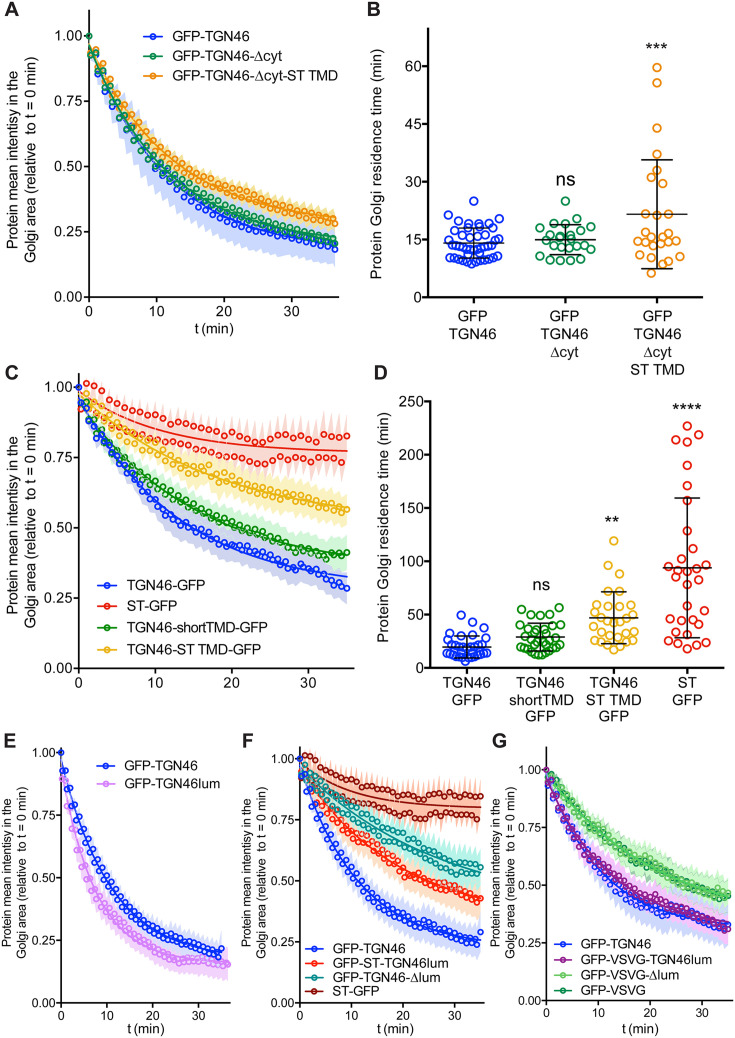
Figure 3.

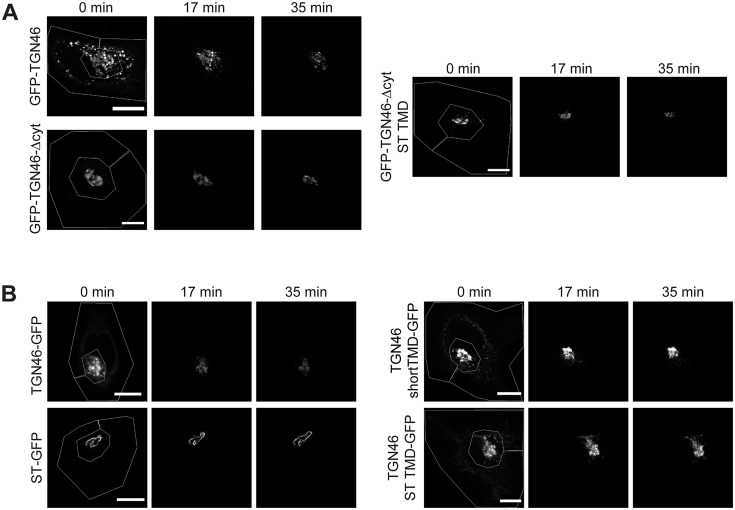
Figure 3—figure supplement 1. Fluorescence loss in photobleaching (FLIP) experiments monitor Golgi residence times of different proteins.

Figure 3—figure supplement 1.

(A) Fluorescence microscopy images obtained from a characteristic FLIP experiment assessing the export rate of GFP-TGN46 (top left row), GFP-TGN46-∆cyt (bottom left row), or GFP-TGN46-∆cyt-ST TMD (right row) from the perinuclear area in HeLa cells. Time from the beginning of the FLIP experiments is indicated, and the area enclosed by the white lines shown in the left images denotes the photobleached area. (B) Fluorescence microscopy images obtained from a characteristic FLIP experiment assessing the export rate of TGN46 WT-GFP (top left row), ST-GFP (bottom left row), TGN46-shortTMD-GFP (top right row), or TGN46-ST TMD-GFP (bottom right row) from the perinuclear area in HeLa cells. Time from the beginning of the FLIP experiments is indicated, and the area enclosed by the white lines shown in the left images denotes the photobleached area. Scale bars are 10 µm.