. 2024 Mar 11;12:RP91708. doi: 10.7554/eLife.91708

Figure 4. TGN46 intra-Golgi localization and CARTS specificity are insensitive to transmembrane domain (TMD) length and composition.

(A) Schematic representation of construct domain topology. The amino acid sequence (in the correct topology) of the different TMDs is indicated. (B) HeLa cells co-expressing the different indicated proteins (green and magenta channels) were fixed, and the localization of those proteins was monitored by fluorescence confocal microscopy. Insets correspond to zoom-in areas of the dashed, white boxed areas. (C) Pearson’s correlation coefficient between the perinuclear fluorescence signal of the x-axis indicated proteins with respect to TGN46-mRFP (empty circles) or ST-mCherry (gray circles), measured from confocal micrographs in (B). Results are at least three cells from each of n = 3 independent experiments (individual values shown, with mean ± stdev; ns, p > 0.05; **p ≤ 0.01; ****p ≤ 0.0001). (D) HeLa cells co-expressing the different indicated proteins (green and magenta channels) were fixed, processed for immunostaining when required, and the localization of those proteins was monitored by fluorescence confocal microscopy. Insets correspond to zoom-in areas of the dashed, white boxed areas. (E) Percentage of transport carriers containing each of the cargoes described on the x-axis that are also positive for pancreatic adenocarcinoma upregulated factor (PAUF; CARTS, empty circles) or VSVG (VSVG carriers, gray circles), as measured from confocal micrographs in (D). Results are from at least 10 cells from each of n = 3 independent experiments (individual values shown, with mean ± stdev; ns, p > 0.05; ***p ≤ 0.001; ****p ≤ 0.0001). Scale bars in (B, D) are 10 µm.

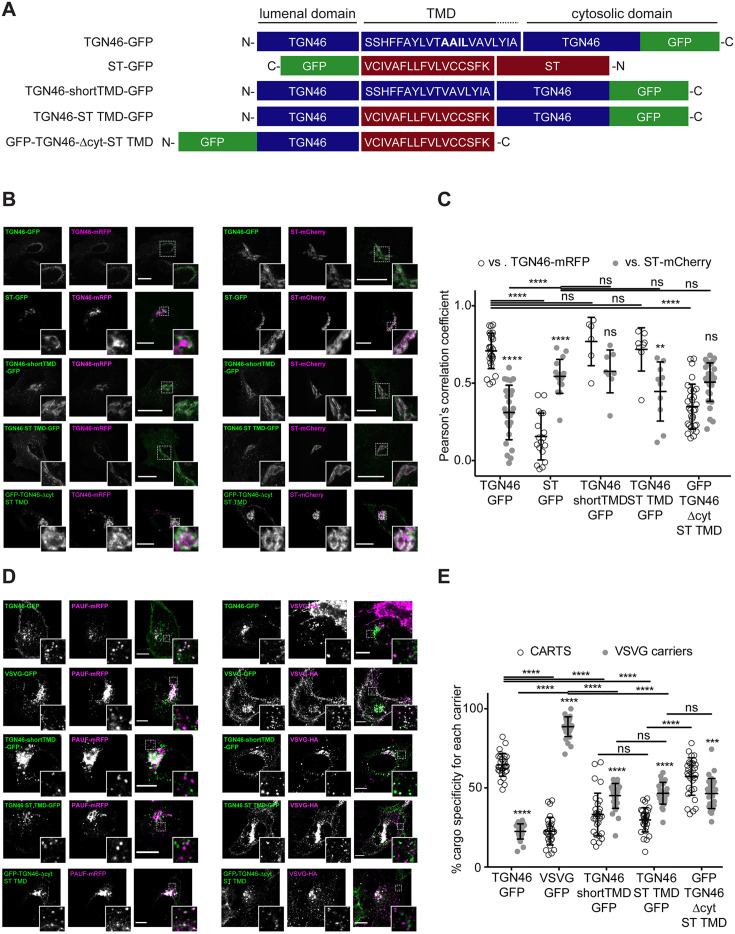
Figure 4.

Figure 4—figure supplement 1. Effect of sphingolipid metabolism on the intra-Golgi localization of TGN46 mutants.

Figure 4—figure supplement 1.

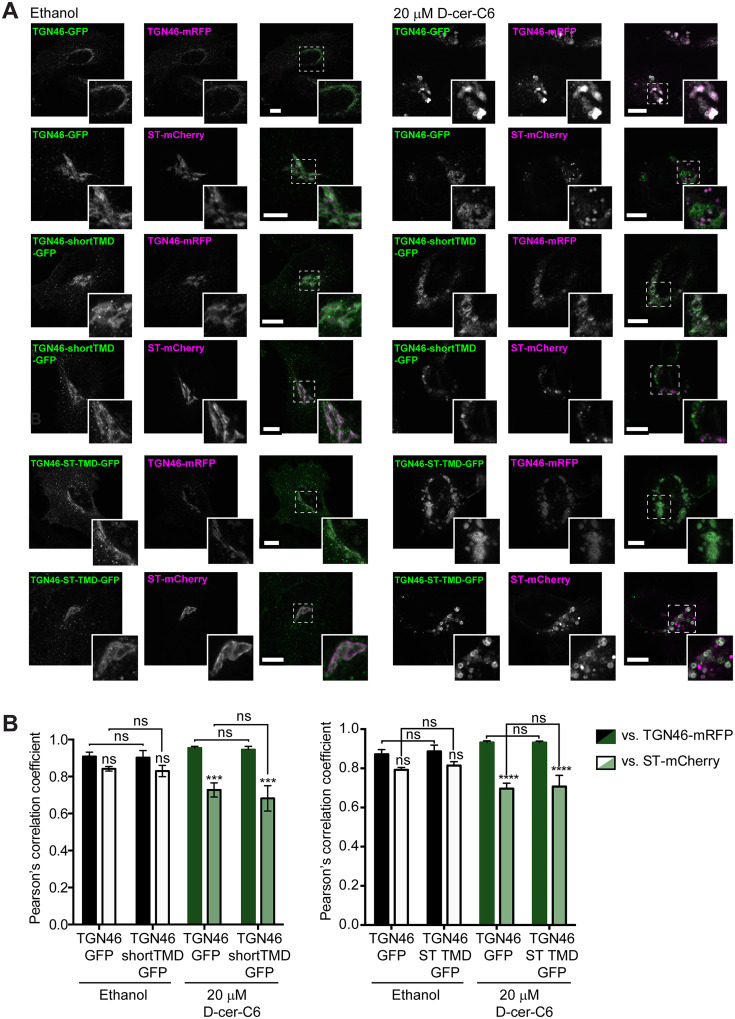
(A) HeLa cells expressing TGN46-GFP, TGN46-shortTMD-GFP, or TGN46-ST TMD-GFP together with TGN46-mRFP or ST-mCherry were treated with ethanol or with 20 μM D-cer-C6 for 4 hr. The localization of these proteins was monitored by fluorescence microscopy. Insets correspond to zoom-in areas of the dashed, white boxed areas. Scale bar, 10 μm. (B) Quantitation of the relative colocalization of the different proteins in the experiments shown in (A), as measured by the Pearson’s correlation coefficient between the green and red channels. Bars show the mean values ± standard error of the mean (s.e.m.) of ≥10 cells counted from three independent experiments; ns, p > 0.05; ***p ≤ 0.001; ****p ≤ 0.0001.
Figure 4—figure supplement 2. STORM analysis of intra-Golgi localization of different TGN46 mutants.

Figure 4—figure supplement 2.

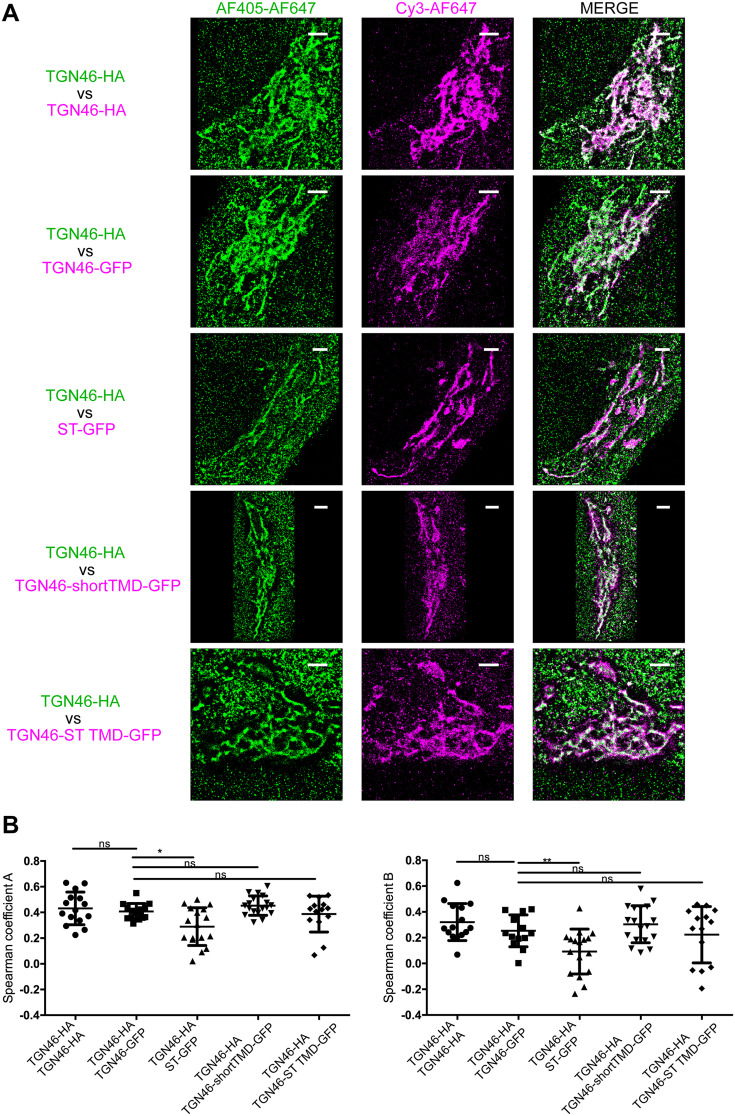
(A) Representative dual-color STORM images of TGN46-HA, labeled using AlexaFluor 405-AlexaFluor 647 (AF405-AF647) conjugated secondary antibodies (green channel), together with TGN46-HA, TGN46-GFP, ST-GFP, TGN46-shortTMD-GFP, or TGN46-ST TMD-GFP, labeled using Cy3-AlexaFluor 647 (Cy3-AF647) conjugated secondary antibodies (magenta channel). Images were rendered using Insight3. Scale bars are 2 µm. (B) Plots of the Spearman coefficient A (between green:magenta channels) and B (between magenta:green channels). Distributions contain information from >5 cells from each of n = 3 independent experiments; individual values are shown, with mean ± stdev; ns, p > 0.05; *p ≤ 0.05; **p ≤ 0.01.
Figure 4—figure supplement 3. Co-expression of different TGN46 proteins does not affect CARTS biogenesis or cargo export rate.

Figure 4—figure supplement 3.

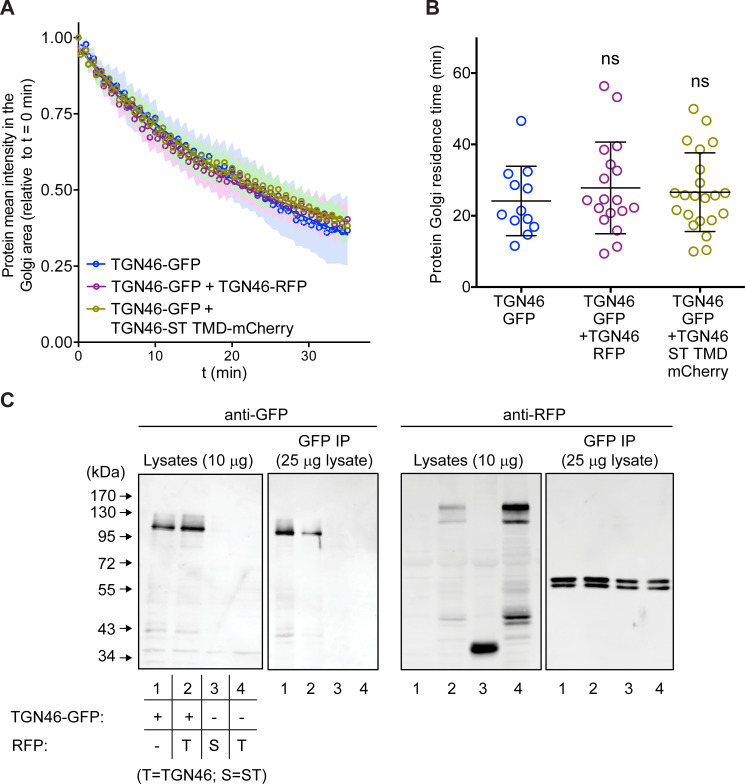
(A) Relative fluorescence intensity average time trace (mean ± standard error of the mean [s.e.m.]) of fluorescence loss in photobleaching (FLIP) experiments for TGN46-GFP obtained in cells expressing the different indicated proteins. Symbols correspond to actual measurements, solid lines to the fitted exponential decays. (B) Residence time in the perinuclear area measured as the half time of the FLIP curves shown in (A). Results are from 4 to 10 cells from each of n = 3 independent experiments (individual values shown, with mean ± stdev). (C) TGN46-GFP and TGN46-mRFP do not co-immunoprecipitate. HeLa cells expressing TGN46-GFP (lane 1), TGN46-GFP and TGN46-mRFP (lane 2), ST-mCherry (lane 3), or TGN46-mRFP (lane 4), were lysed and part of the lysate was immunoprecipitated with an anti-GFP antibody. Both the lysate and immunoprecipitated fraction were analyzed by sodium dodecyl sulfate–polyacrylamide gel electrophoresis (SDS–PAGE) and Western blotting with anti-GFP and anti-RFP antibodies.
Figure 4—figure supplement 3—source data 1. Uncropped images of the membranes of the Western blotting shown in Figure 4—figure supplement 3C.