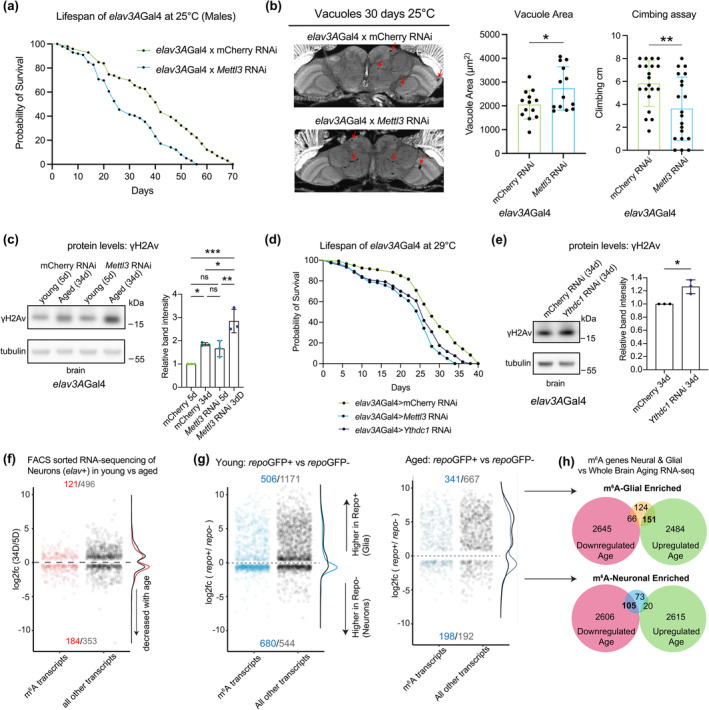
FIGURE 3.

Reduction of m6A methyltransferase Mettl3 in neurons decreased lifespan. (a) Lifespan of animals expressing control RNAi or Mettl3 RNAi in neurons (elav3AGal4 > mCherry RNAi vs. elav3AGal4 > Mettl3 RNAi). 25°C, n = 100, n = 100, ****p < 0.0001, Log‐rank test. (b) Paraffin sectioning of brains at 30d. Brain vacuoles highlighted by red arrows. Quantification of total vacuole area per brain calculated across 10 sections per brain, n = 12 brains. *p < 0.05, t‐test, p = 0.0337. Negative geotaxis assay to measure climbing ability at 30d. n = 20 flies. **p < 0.01, t‐test, p = 0.0064. (c) γH2Av levels in brain tissue, with age and Mettl3 knockdown in neurons 5d versus 34d. (elav3AGal4 > mCherry RNAi; elav3AGal4 > Mettl3 RNAi). N = 10 brains per replicate, 3 biological replicates. *p < 0.05, **p < 0.01, ***p < 0.001, ns = not significant, One‐way ANOVA, p = 0.0392, p = 0.0004, p = 0.0174, p = 0.0065. (d) Lifespan of animals expressing control RNAi, Ythdc1 RNAi or Mettl3 RNAi in neurons (29°C). n = 120, n = 120, n = 120 ****p < 0.0001, Log‐rank test. (e) Levels of γH2Av in brain tissue with Ythdc1 knockdown in neurons 34d, *p < 0.05, t‐test, p = 0.0123. (f) Differentially expressed transcripts of elav3AGFP+ cells 34d versus 5d. Red are m6A transcripts, black all other transcripts. p adj < 0.05. (g) Differential expression of repoGFP+ (Glial) cells versus repoGFP‐ (neuronal) cells at 5d (left) and 34d (right). Blue are m6A transcripts, black all other transcripts. Transcripts more highly expressed in repoGFP+ cells are considered glial enriched. (h) Comparison of glial‐enriched m6A transcripts (top) and neural‐enriched m6A transcripts (bottom) to the whole brain aging transcriptome 3d versus 50d (see Figure 1).
