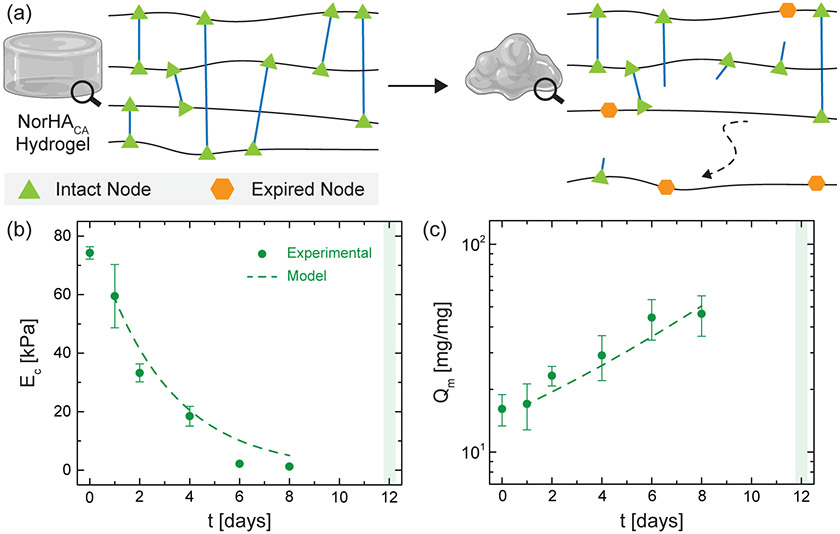
Figure 4.
Modeling the degradation behavior of NorHACA hydrogels. a) Schematic overview of the modeling approach employed to characterize NorHACA hydrogel degradation. Model fit (dotted line, k = 0.350 day−1) for the (b) compressive modulus (EC) and (c) mass swelling ratio (Qm) of a select NorHACA hydrogel (5 wt.%, 40% mod.) over time, with comparisons to experimental data (symbols). Shaded box indicates time point for complete degradation of the hydrogel. Data are reported as mean ± SD; n ≥ 3. Hydrogel schematics created using BioRender.

