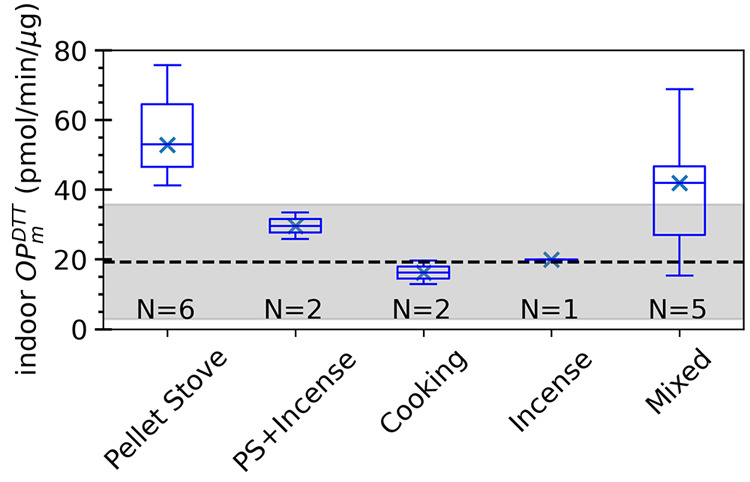
Figure 3.

Boxplots of indoor OPmDTT during different perturbation experiments relative to indoor Background OPmDTT, where Background is from measurements in the empty house prior to any indoor experiments and only due to infiltration of outdoor air. The mean Background OPmDTT is indicated by the dashed line, and the shaded region represents its standard deviation. The two categories, pellet stove + incense and pellet stove + incense + outdoor car, with only one data point each, have comparable OPmDTT levels and have been merged (PS + Incense) in this plot. The marker and line in the box indicate the median value (Q2), the lower and upper box boundaries indicate the first quartile (Q1) and the third quartile (Q3), and the whiskers indicate the minimum and maximum values for each corresponding category.
