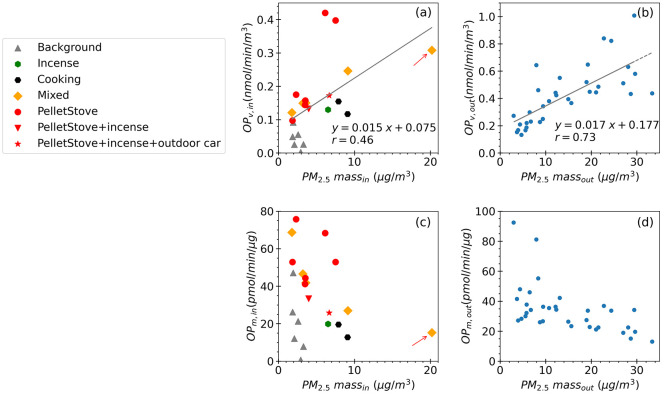
Figure 4.
Scatter plots between indoor PM2.5 mass concentration and (a) indoor OPv (c) indoor OPm during different perturbation experiments, and between outdoor PM2.5 mass concentration and (b) outdoor OPv, (d) outdoor OPm during the whole study period based on 24-h averaged data. Orthogonal regression was applied in (a) and (b). The outlier of high PM2.5 indoor mass highlighted with an arrow in (a) is also identified in plot (c).

