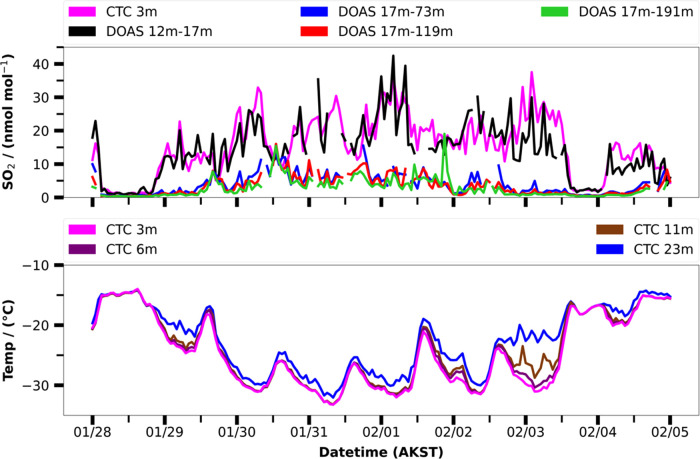
Figure 8.
Vertical profiling of SO2 gas (averaged over the specified altitude interval) by the UCLA LP-DOAS, in-situ SO2 measurement at 3 m AGL and temperature measured between 3 and 23 m during the cold polluted event. The strength of the surface-based inversion can be visualized at the difference in temperature between 23 m and 3 m, which peaks at night, particularly during 1–3 January 2022.

