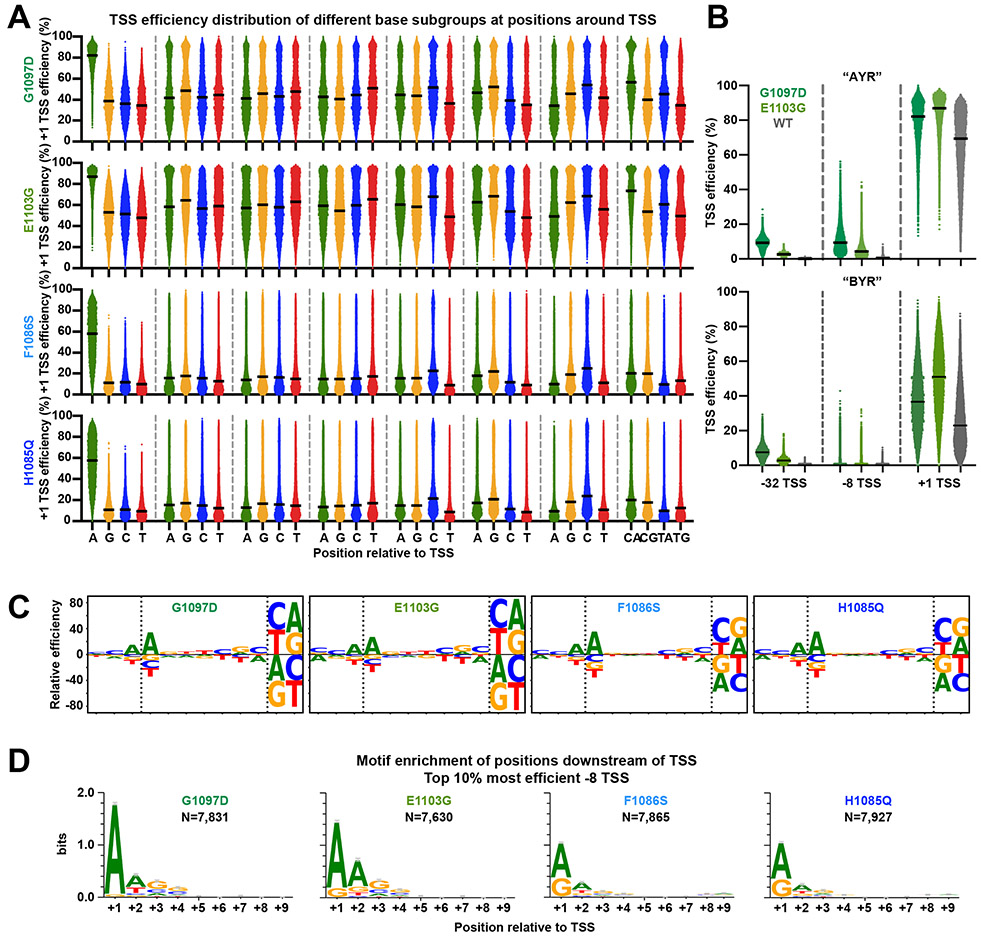
Extended Data Figure 4. Pol II mutants alter TSS efficiency in general.
(A) TSS efficiency distributions of designed +1 TSSs of Pol II mutants for base subgroups at individual positions relative to +1. Identical analysis as in Extended Data Figure 2B for WT Pol II. (B) Pol II GOF G1097D showed greater increase in efficiency than GOF allele E1103G at upstream TSSs (designed −32 and −8 TSSs), while E1103G showed stronger effects at designed +1 TSS than G1097D. (C) Pol II initiation sequence preference in Pol II mutants. Identical analysis as in Figure 3B for WT Pol II. (D) Motif enrichment for top the 10% most efficient −8 TSSs for Pol II mutants. Identical motif enrichment analysis as in Extended Data Figure 2D top panel for WT Pol II. Numbers (N) of variants assessed are indicated. Bars represent an approximate Bayesian 95% confidence interval.

