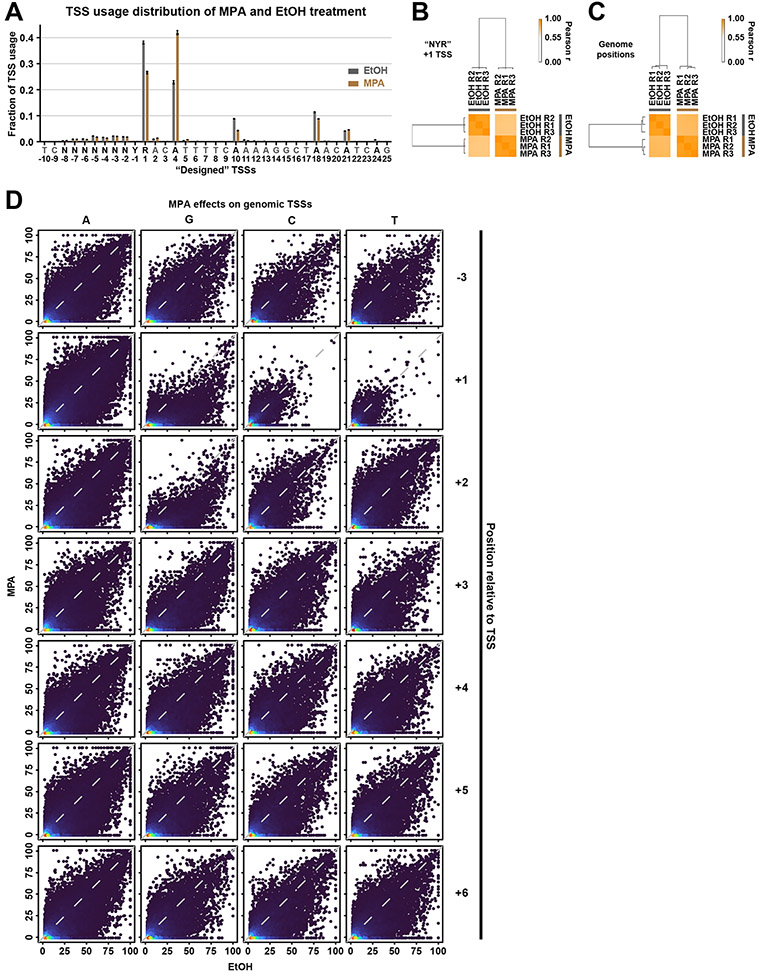
Extended Data Figure 5. High of reproducibility of TSS usage and efficiency upon MPA treatment.
(A) TSS usage distributions at designed −10 to +25 TSSs in WT “NYR” library (mixed AYR and BYR libraries) treated with 100% ethanol or with 20 ug/ml MPA. MPA treatment shifted TSS usage downstream relative to EtOH treatment. Dots represent three biological replicates. Bars are mean +/− standard deviation of the mean. (B) Hierarchical clustering of Pearson correlation coefficients of TSS efficiencies for designed +1 TSS for three biological replicates for MPA or EtOH treatment, illustrated as a heat map. (C) Hierarchical clustering of Pearson correlation coefficients of TSS efficiencies for all genome positions within defined promoter windows with >=3 reads in each replicate, illustrated as a heat map. (D) Correlation plots for combined biological replicates for TSS efficiency upon MPA treatment (y axes) versus EtOH treatment (x axes) for all TSSs ≥ 2% efficiency in the 25%-75% of the distribution for a curated set of 5979 yeast promoters (see Methods). TSSs are separated into groups depending on base identity at positions −3 (control) or positions +1 to +6.

