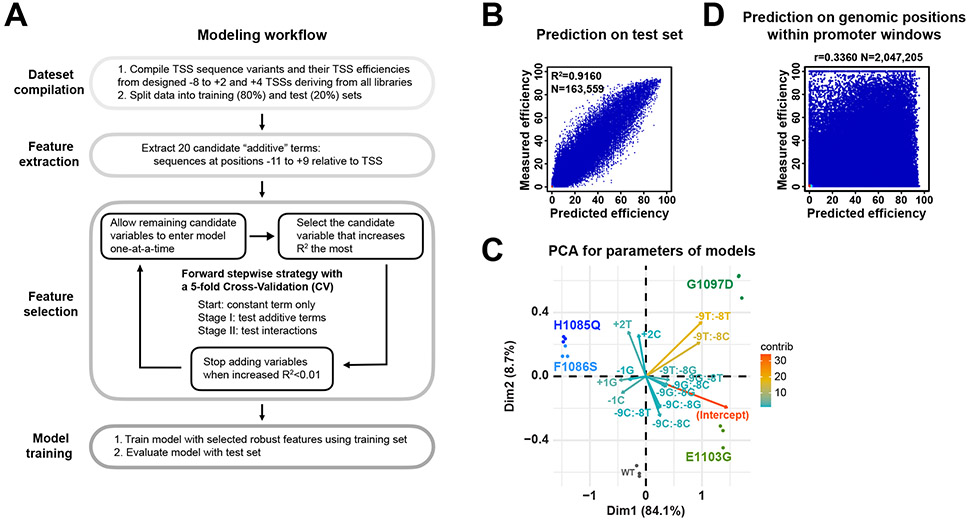
Extended Data Figure 6. Modeling identifies sequence features for TSS selection in WT and Pol II mutants.
(A) Overview of TSS efficiency modeling. (1) TSS efficiencies including designed −8 to +2 and +4 TSSs deriving from “AYR”, “BYR” and “ARY” libraries were pooled for modeling. (2) Sequences from −11 to +9 relative to variant TSSs were extracted. (3) To identify robust features, a forward stepwise selection strategy coupled with a 5-fold cross-validation for logistic regression was used, with random splitting into training (80%) and test (20%) sets. Stepwise regression starting with a constant term only with stepwise variable addition, until a stopping criterion is met, was performed. Additive terms (sequences at positions −11 to +9) and interactions were tested in stages. Model performance was evaluated with R2. The stopping criterion for adding additional variables was an increase R2 < 0.01. (4) A logistic regression model containing selected robust features was trained using the training set and then evaluated with the test set. (B) Comparison of measured efficiencies and predicted efficiencies. Model performance R2 on entire test set and number of data points shown in plot are shown. (C) PCA analysis for parameters of models trained using individual replicates of WT and Pol II mutant. Close clustering of individual replicates indicates that models are not overfit. The top 15 contributing variables are shown. GOF and LOF mutants were separated from WT by the 1st principal component. GOF G1097D and E1103G were further distinguished by 2nd principal component by additional position +2 information, which is consistent with results in Extended Data Figure 4D, where G1097D and E1103G differentially altered +2 sequence enrichment. (D) A scatterplot of comparison of measured and predicted TSS efficiencies of all positions within 5979 known genomic promoter windows 21 with available measured efficiency. Pearson r and number (N) of compared variants are shown. Most promoter positions (82%, 1,678,406 out of 2,047,205) showed no observed efficiency, which is expected because TSSs need to be specified by a core promoter and scanning occurs over some distance downstream.

