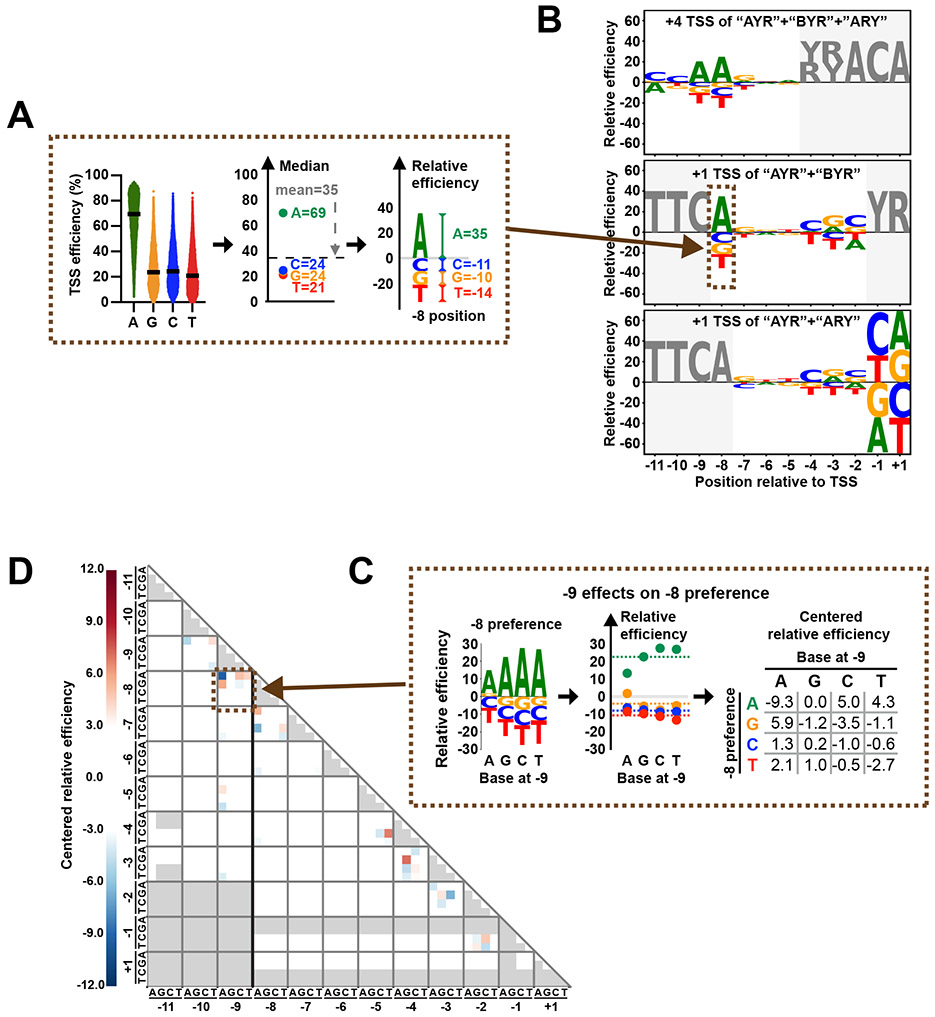
Figure 3. Sequence contributions to Pol II initiation efficiency from positions surrounding the TSS.
(A) Schematic illustrating how “relative efficiency” is calculated and visualized in B. At sequence positions relative to a TSS, all variants were divided into the four base subgroups at each position. Next, median values for each group were centered based on the mean of all median values. Centered median values were defined as “relative efficiencies”, representing preferences for bases at each position. Relative base efficiencies were visualized as sequence logos. Positive and negative values indicate relatively preferred or less preferred bases, respectively. (B) Pol II initiation shows distinct sequence preferences around TSSs. Preferences generated using designed +4 TSS deriving from “AYR”, “BYR” and “ARY” libraries (top). Preferences using datasets of designed +1 TSS deriving from “AYR” and “BYR” libraries (middle). Preferences using datasets of designed +1 TSS deriving from “AYR” and “ARY” libraries (bottom). Positions that contain fixed or not completely randomized bases are shown in grey. (C) Schematic illustrating how sequence interaction between positions is calculated and visualized as a heat map in D. Using −9/−8 positions as an example, relative efficiencies at position −8 were calculated when different bases were present at position −9. Next, relative efficiencies of each base were centered based on the mean of all relative efficiencies of a particular base. After centralization, negative and positive values indicate negative and positive interactions. Interaction scores for two sequence positions are read at the intersection of the x and y axes labeled by base and position. The centered relative efficiencies matrix was visualized as a heat map to represent the interaction between examined positions. (D) Sequence interactions were mainly observed at neighboring positions. Red and blue indicate positive and negative interactions, respectively. Missing values are shown in grey. Interactions related to positions −11 to −9 were calculated using datasets of designed +4 TSS deriving from “AYR”, “BYR” and “ARY” libraries. Other interactions were calculated using datasets of designed +1 TSS deriving from “AYR” and “BYR” libraries.

