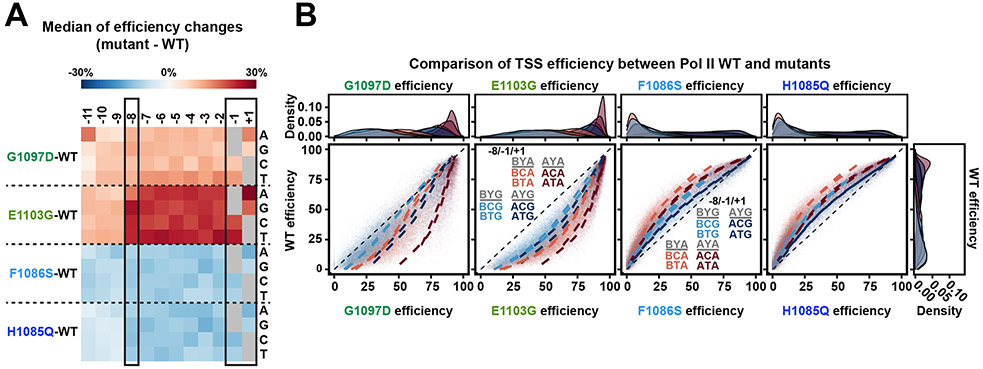
Figure 4. Pol II mutants alter TSS efficiency for all possible TSS motifs while showing selective effects for base at +1.
(A) Pol II mutants alter TSS efficiencies across all motifs, corresponding to their direction of change to Pol II catalytic activity in vitro. TSS efficiency changes for each TSS variant were first determined by subtracting WT efficiency from Pol II mutant efficiency. The medians of efficiency changes for variant groups with indicated bases at each position relative to TSS were then calculated and illustrated in a heat map. Positive (red) values indicate Pol II mutants increased overall efficiency while negative (blue) values indicate decreased overall efficiency. (B) WT TSS efficiency for TSS variants divided into motif groups are plotted for mutant TSS efficiencies for the same TSS groups. The eight possible groups of TSSs for A/B−8C/T−1A/G+1 motifs were plotted and curve fit. Histograms show density of variants within each −8/−1/+1 subgroups. As to position −8, A−8 containing motifs show higher efficiency than B−8 containing motifs in both Pol II GOF (G1097D and E1103G) and LOF (F1086S and H1085Q) mutants (A−8 motifs: maroon and blue vs B−8 motifs: light coral and light blue). This is consistent with the proposed function of −8A to retain TSSs longer in the Pol II active site during scanning. This means that −8A may boost the positive effects of GOF mutants, therefore Pol II GOF mutants showed greater effects on A−8 motifs compared to B−8 motifs. In contrast, −8A compensates for active site defects of LOF mutants, therefore Pol II LOF mutants showed reduced effects on A−8 motifs compared to B−8 motifs. Both GOF and LOF mutants show reduced effects on G+1 motifs relative to A+1 motifs (G+1 motifs: light blue and blue vs A+1 motifs: light coral and maroon).

