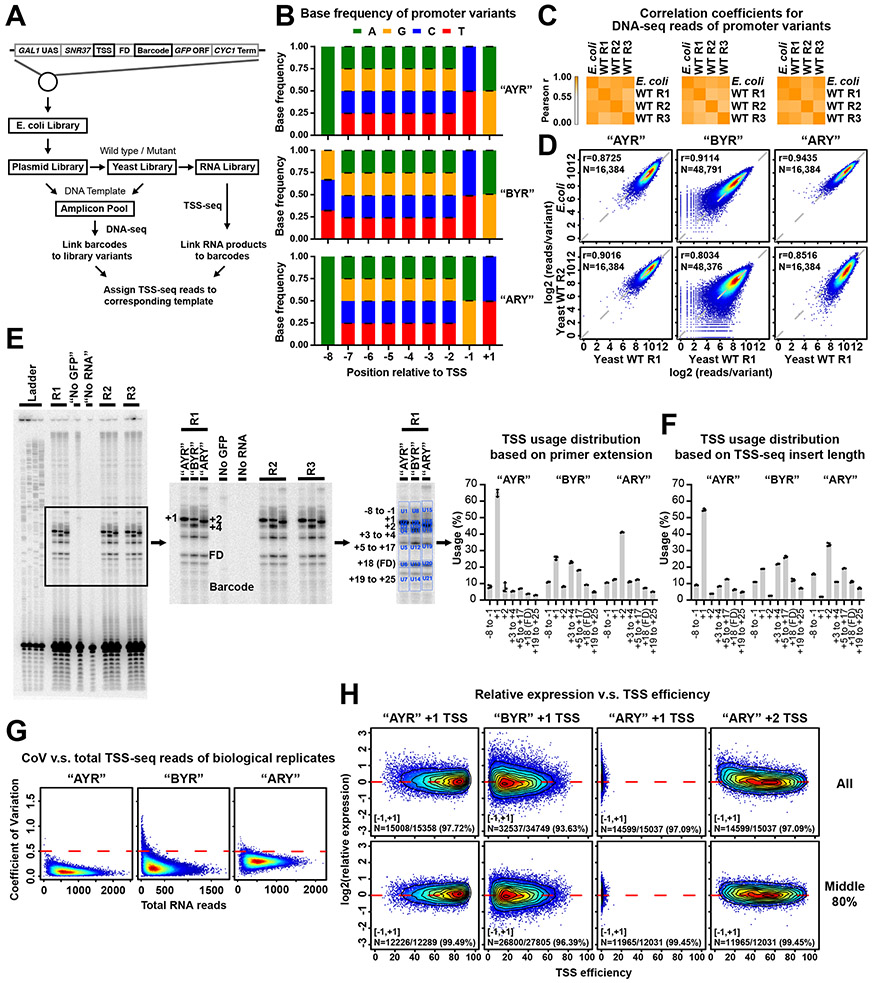
Extended Data Figure 1. High level of reproducibility and coverage depth of library variants.
(A) Schematic of experimental approach. Promoter libraries with almost all possible sequences within a 9 nt randomized region were constructed on plasmids. Libraries were designated “AYR”, “BYR”, and “ARY” based on randomized region composition. Plasmids were amplified in E. coli and transformed into yeast with wild type or mutated Pol II. DNA and RNA were extracted and prepared for DNA-seq and TSS-seq. (B) Base frequencies at positions within the randomized region of promoter variants demonstrate unbiased synthesis of randomized regions. Bars are mean +/− standard deviation of the mean for promoter variants in WT and four Pol II mutants. (C) Heatmap illustrating hierarchical clustering of Pearson correlation coefficients of reads per promoter variant E. coli libraries and three biological replicates of libraries transformed into yeast. (D) Example correlation plots of DNA reads count of promoter variants for E. coli and yeast WT biological replicates. Pearson r and number of compared variants are shown. (E) Bulk primer extension for RNA produced from promoter variant libraries transformed into WT yeast. “No GFP” control used RNA from an untransformed strain. “No RNA” control used a sample of nuclease-free water. Dots represent three biological replicates. Bars are mean +/− standard deviation of the mean. (F) TSS usage based TSS-seq read lengths from transformed libraries. Dots represent three biological replicates. Bars are mean +/− standard deviation of mean. Distributions are similar to the distributions in E. Note that primer extension will blur usage into adjacent upstream position due to some level of non-templated addition of C to RNA 5’ ends. (G) Heat scatter plots of Coefficient of Variation (CV, y axis) versus total RNA reads per promoter variant in each Pol II MASTER library. A cutoff of CV = 0.5 was used to filter higher variance variants. (H) Heat scatter plots of relative expression versus TSS efficiency of major TSSs per promoter variant, with contour lines indicating deciles of data. Number of promoter variants with [−1, +1] relative expression values (log2) and corresponding percentage of total promoter variants are shown.

