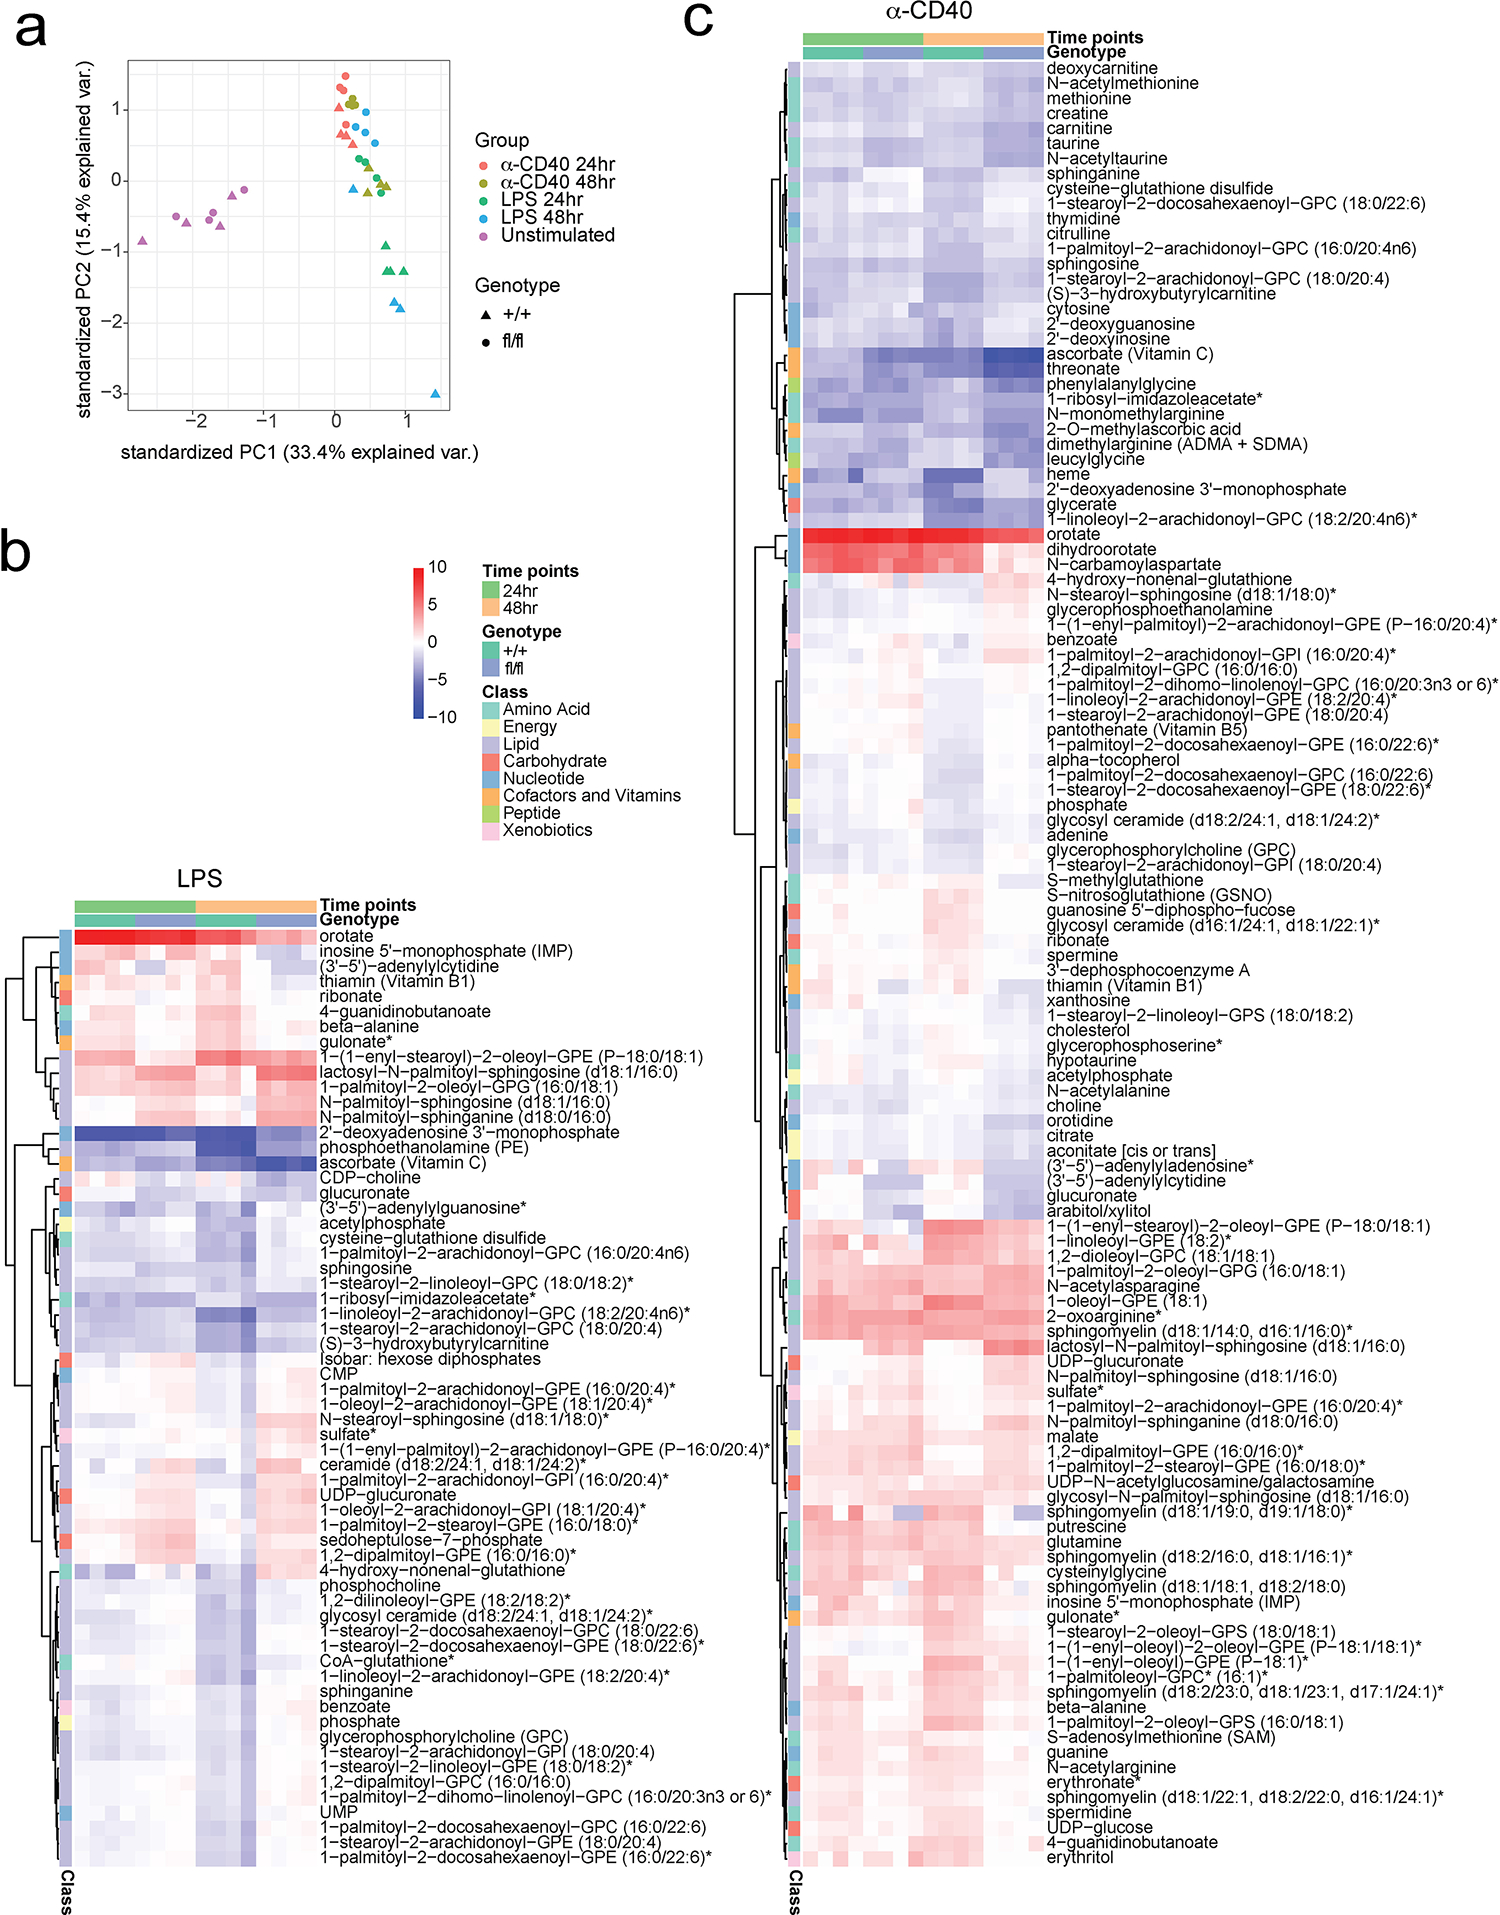
Extended Data Fig. 9. Metabolomics reveals global metabolic changes in SCAP deficient B cells.

Splenic B cells isolated from SCAP+/+ CD19Cre/+ (+/+) mice and SCAPfl/fl CD19Cre/+ (fl/fl) mice were stimulated with 10 μg/ml LPS or 5 μg/ml anti-CD40 tetramer for 24 and 48 hours. Cells were then analyzed by metabolomics. a. PCA plot showing the differences of all replicates between different treatments in different genotypes. b-c. Heatmap of altered metabolites (FDR < 0.05, log2 Fold Change >1) marked by their pathways. Colors represent log2 FC relative to the untreated corresponding genotype samples. Four biological replicates generated from two experiments were used for metabolomics analysis.
