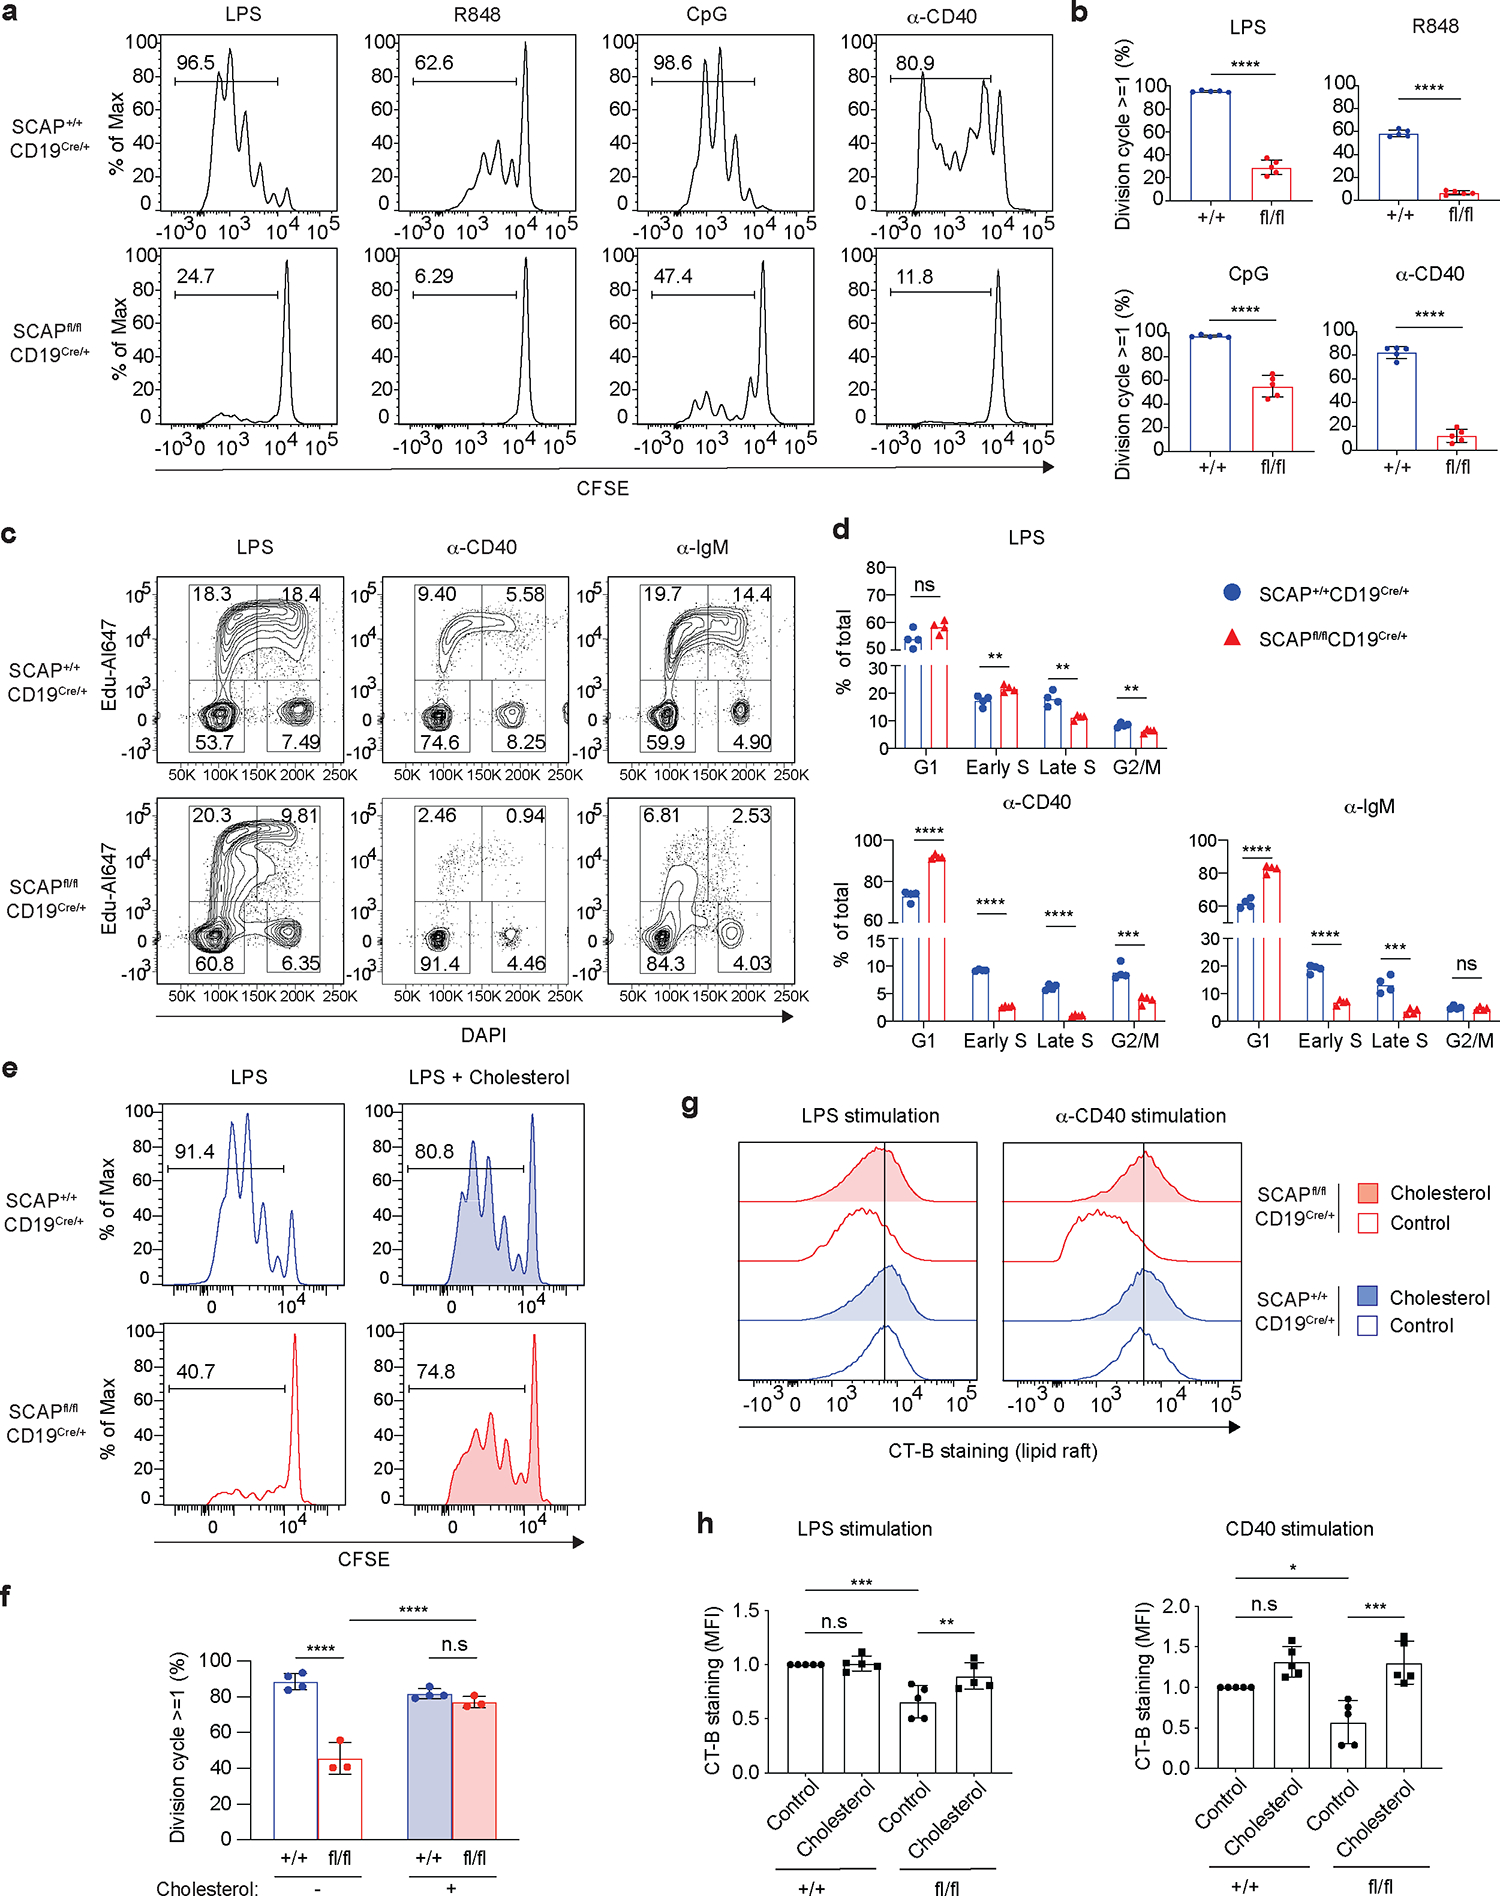
Fig.3 |. B cell SREBP signaling is required for mitogen stimulated cell cycle progression.

a-b. Splenic B cells isolated from SCAP+/+ CD19Cre/+ (+/+) mice and SCAPfl/fl CD19Cre/+ (fl/fl) mice were labeled with CFSE. Then cells were stimulated with 10μg/ml LPS, 10μg/ml CpG or 10μg/ml R848 for 3 days, or 5μg/ml ⍺-CD40 tetramer for 5 days. Cell proliferation was examined by CFSE dilution using FACS. a. The representative histogram of CFSE dilution; b. The statistical analysis of 5 mice from 2 independent experiments (mean ± SD). c-d. Splenic B cells were stimulated with 10μg/ml LPS, 5μg/ml ⍺-CD40 tetramer or 20μg/ml ⍺-IgM for 48 hours. Cell cycle phases (G1, S, G2/M) were analyzed by FACS with EdU and DAPI. c. The representative FACS plots showing EdU and DAPI staining. d. The statistical analysis of 4 mice from 2 independent experiments (mean). e-f. Splenic B cells were stimulated with 10μg/mL LPS and cultured with or without 5μg/mL MβCD conjugated cholesterol for 3 days. e. The representative histogram of CFSE dye dilution. f. Quantification of B cell division of 4 +/+ and 3 fl/fl mice from 2 independent experiments (mean ± SD). g-h. Splenic B cells were stimulated with 10μg/mL LPS or 5μg/ml α-CD40 tetramer and cultured with or without 5μg/mL MβCD conjugated cholesterol for 48 hours. Lipid raft was analyzed by FACS with CT-B staining. g. The histogram of CT-B staining. h. The statistical analysis of 5 mice from 2 independent experiments (mean ± SD). MFI values were normalized to +/+ samples with control given a value of 1. P values were determined by two-tailed unpaired t-test (b, d) or by one-way ANOVA followed by Tukey’s multiple comparisons test (f, h). *P≤0.05, **P≤0.01, ***P≤0.001, ****P≤0.0001, ns: P>0.05.
