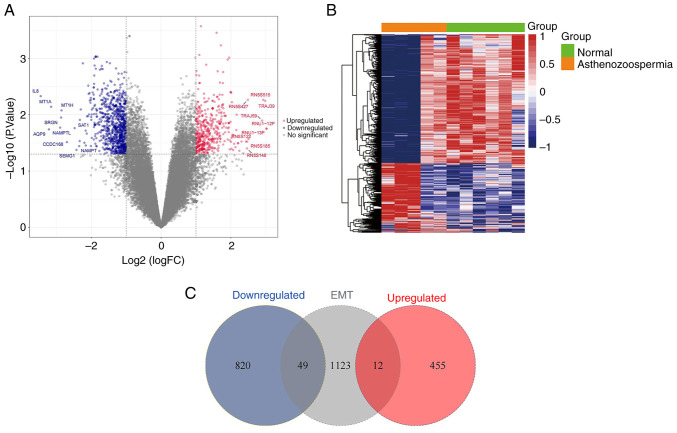
Figure 2.
Filtered DEGs from the GSE160749 and EMT datasets. (A) Volcano plot of 1,336 DEGs in six fertile control samples and five asthenozoospermia samples of the GSE160749 dataset. The red points represent upregulated DEGs, the blue points represent downregulated DEGs, and the gray points represent no significant DEGs. X-axis represents fold change, and the farther point from the center with the greater significant difference; Y-axis represents -log10 (P-value) results, and the closer point to the top with the greater significant difference. (B) Heatmap of 1,336 DEGs in six fertile control samples and five asthenozoospermia samples of the GSE160749 dataset. The X-axis represents the samples and the Y-axis represents the genes. The red and blue rectangles respectively represent upregulated and downregulated genes. The deeper red colors indicate the higher expression of genes, the deeper blue colors indicate the lower expression of genes. The black connecting lines indicate the clustering relation among the genes. (C) Venn analysis of the upregulated (red) and downregulated (blue) DEGs intersected with the EMT datasets (gray). DEGs, differentially expressed genes; EMT, epithelial-mesenchymal transition.

