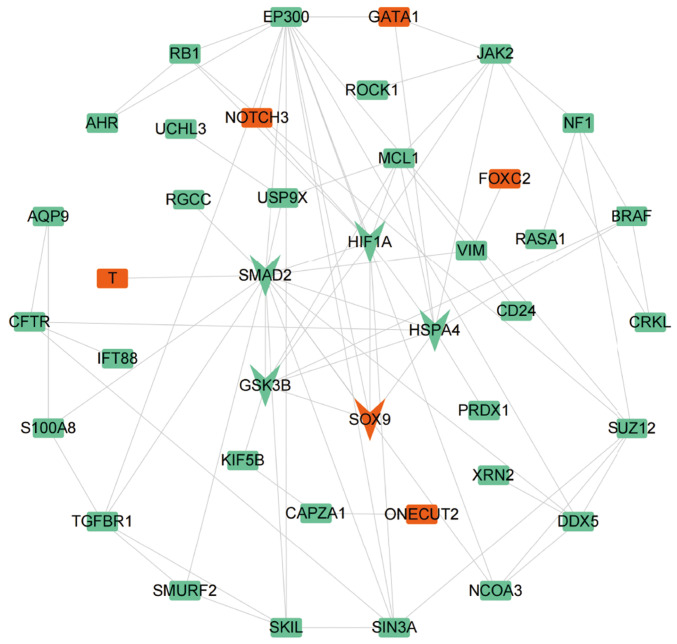
Figure 4.
Construction of a PPI network for the differentially expressed genes of 61 candidates. There are 40 nodes and 80 edges in the PPI network. Each node represents a protein, the orange and green colors respectively indicate upregulated and downregulated genes. Each edge represents a link with two proteins, indicating the functional association between proteins. HIF1A, HSPA4, SOX9, GSK3B, and SMAD2 is the highest score cluster (score=5.00) which include five nodes and 10 edges. PPI, protein-protein interaction.

