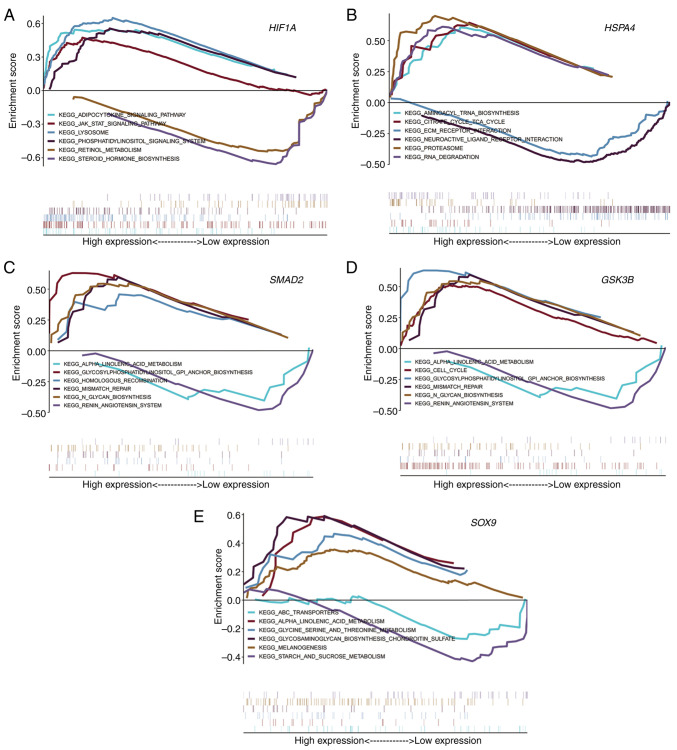
Figure 6.
Pathway enrichment analysis of the five key genes. Each key gene display six representative KEGG enrichment pathways. The curve above the X-axis indicates that the gene set of the KEGG pathway, where the key gene is located, is highly expressed in the asthenozoospermia group and vice versa, indicating low expression. (A) HIF1A. (B) HSPA4. (C) SMAD2. (D) GSK3B. (E) SOX9. KEGG, Kyoto Encyclopedia of Genes and Genomes.

