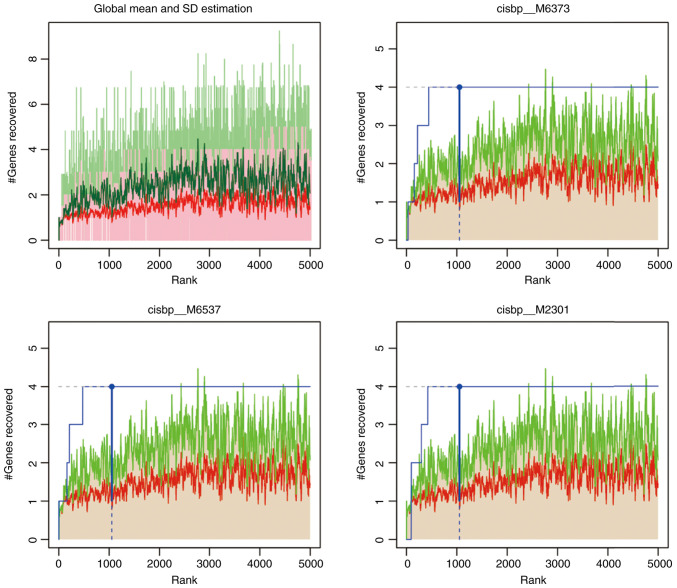
Figure 7.
Normalized enrichment score of the top 3 motifs from the cumulative recovery curve. Red line, the global mean of the recovered curve of motif. Green line, mean ± standard deviation. Blue line, the recovered curve of the current motif. Motif is statistically significant when the recovered curve is greater than the mean ± standard deviation.

