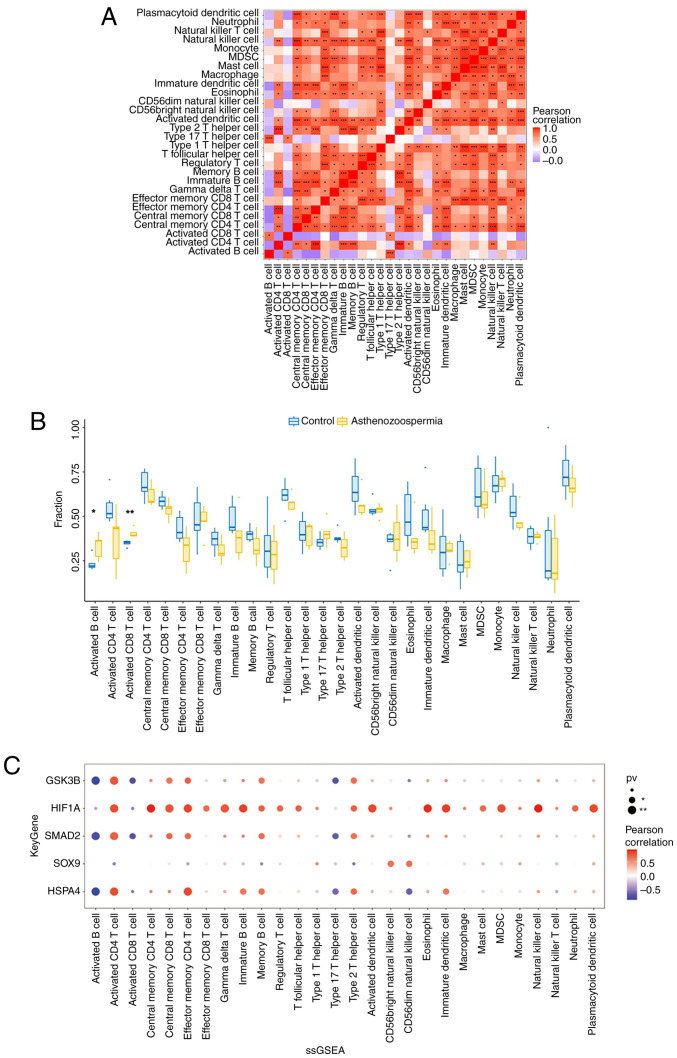
Figure 9.
Correlation analysis of the five key genes and immune cells. (A) Correlations of multiple immune cells in the 11 semen samples from the GSE160749 dataset analyzed using Pearson's method. (B) Comparison of the levels of immune cells in the 11 semen samples from the GSE160749 dataset using the Wilcoxon rank-sum test. (C) Correlations of the expression levels of the five key genes and multiple immune cells in the 11 semen samples from the GSE160749 dataset analyzed using Pearson's method. *P<0.05, **P<0.01 and ***P<0.001. ssGSEA, single-sample gene set enrichment analysis.

