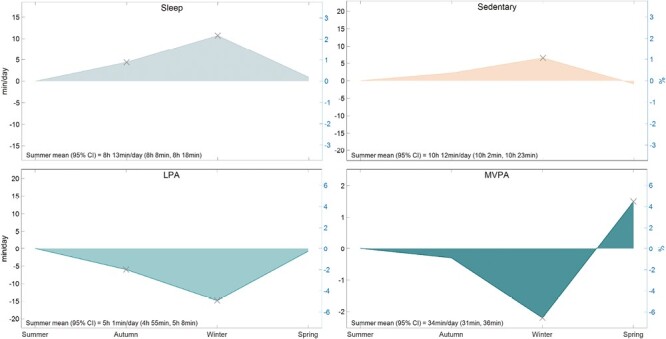
Fig. 2.

Seasonal modeled changes as compared to summer (n = 363). Total days included in analysis = 29,300. Mean (range) of days contributed per participant = 81 days (1–123 days). LPA light physical activity; MVPA moderate-to-vigorous physical activity. X = change from summer (p < .05). Percent range (right y-axis) is ± 3% for sleep and sedentary, ± 6% for LPA and MVPA.
