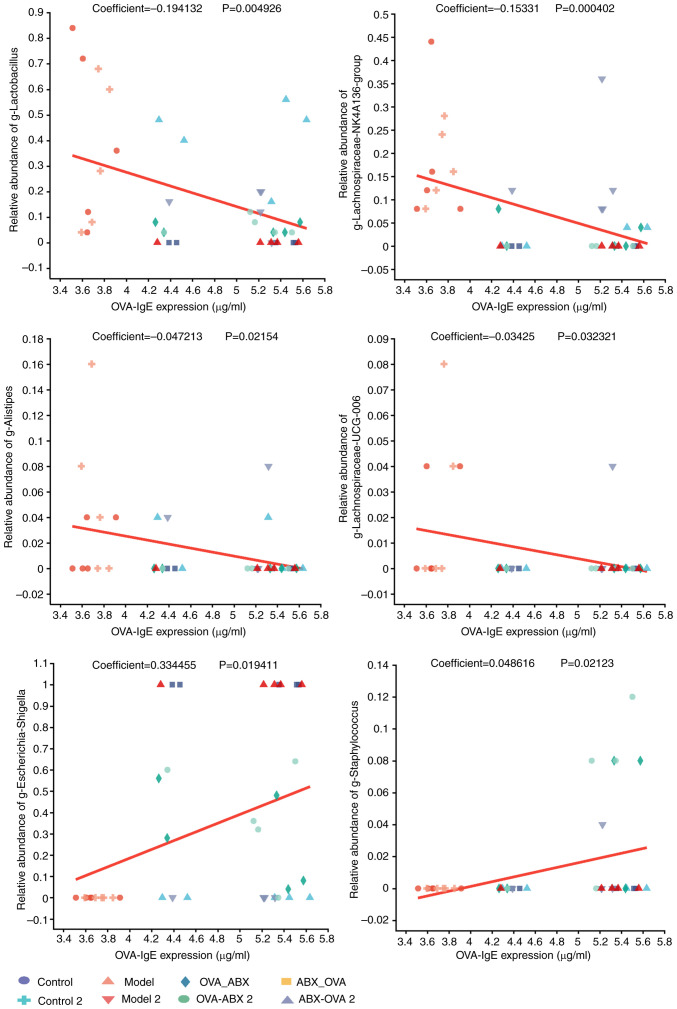
Figure 9.
OVA-induced IgE expression is correlated with enterobacterial abundance. Linear correlation between distinct genera and environmental variables. The X-axis represents environmental variables, while the Y-axis indicates the relative abundance of a species. Coefficient value indicates the magnitude of the correlation coefficient between environmental factor variables and species abundance. A value greater than 0 indicates that environmental factors are positively correlated wit h the relative abundance of a species, while a value equal to 0 indicates that there is no correlation. The P-value was used to measure the reliability of the test. P<0.05 indicates that the environmental variables are significantly correlated with the species' abundance. OVA, ovalbumin; IgE, immunoglobulin E.

