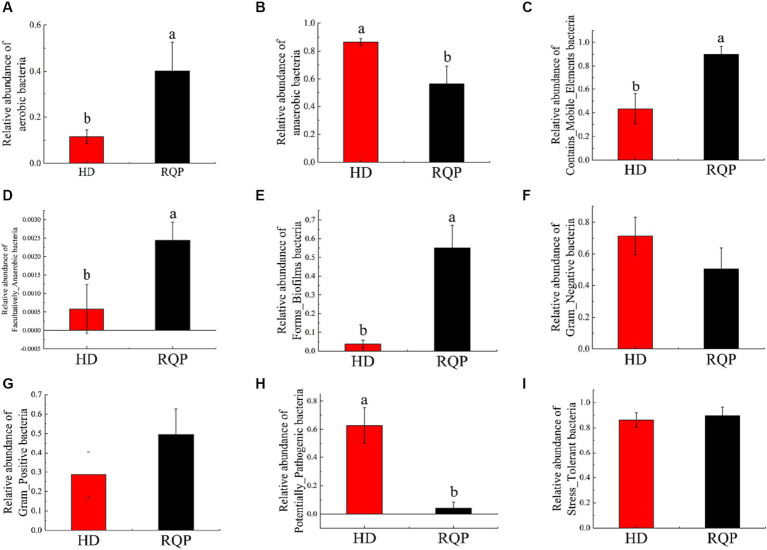
Figure 13.
Effects of RQP on microbiome phenotypes. (A) aerobic bacteria; (B) anaerobic bacteria; (C) Contains_Mobile_Elements bacteria; (D) Facultatively_Anaerobic bacteria; (E) Forms_Biofilms bacteria; (F) Gram_Negative; (G) Gram_Positive; (H) Potentially_Pathogenic; (I) Stress_Tolerant. Data are presented as the mean ± SD (n = 3). Data followed by the different letters are significantly different (p < 0.05) by Duncan’s test.

