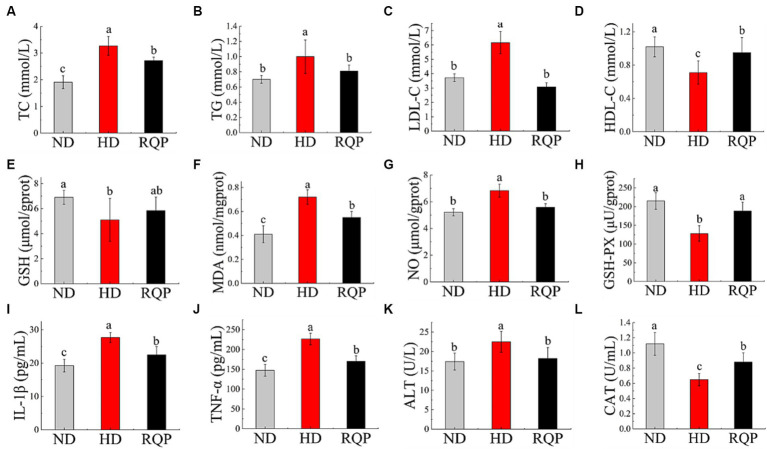
Figure 6.
Effects of RQP on lipid level, antioxidant levels and inflammatory factors. (A) TC; (B) TG; (C) LDL-C; (D) HDL-C; (E) GSH; (F) MDA; (G) NO; (H) GSH-PX; (I) IL-1β; (J) TNF-α; (K) ALT; (L) CAT. The values are expressed as means ± SD (n = 5). Data followed by the different letters are significantly different (p < 0.05) by Duncan’s test.

