Fig. 1.
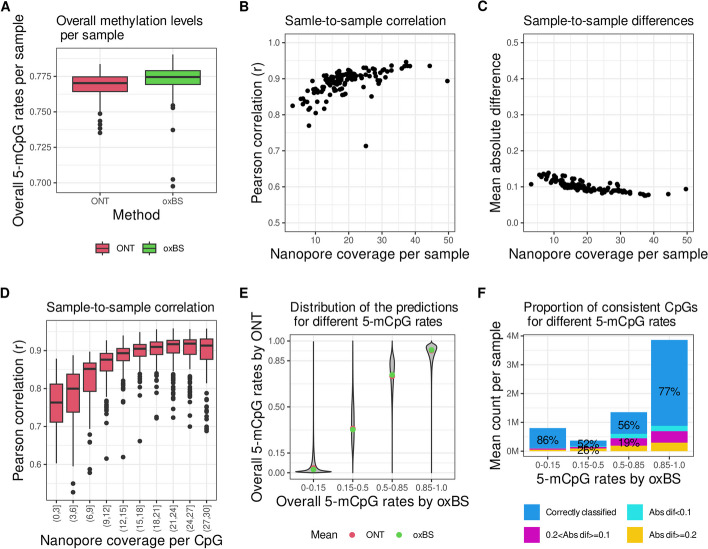
Nanopore sequencing and oxBS performance in the same DNA samples. The consistency in 5-mCpG rates measured by nanopore sequencing and oxBS in DNA samples isolated from the same 132 individuals was estimated by the following: A The overall measurement of 5-mCpG rates in each of the 132 DNA samples measured by ONT (red) and oxBS (green), Y-axis is limited to (0.7,0.8). The center line (solid black) shown in each box represents the median; the box limits represent the upper and lower quartiles; the whiskers represent 1.5 × interquartile range. B The Pearson r correlation coefficient, y-axis, and C mean of the absolute differences in 5-mCpG rates of each CpG, y-axis, with respect to nanopore sequencing coverage in each sample on the x-axis. Panels D, E, and F analyze sites that have > 25 × coverage in oxBS. D CpG coverage underlying the 5-mCpG rates, i.e., the number of sequences that were used to compute the 5-mCpG rate for a given CpG, in nanopore sequenced samples, x-axis, influences the consistency (Pearson r), y-axis, with 5-mCpG rates measured with high coverage by oxBS. The y-axis is limited to (0.5, 1) E CpG rates in nanopore (y-axis) and oxBS (x-axis, binned). The mean is represented with red (ONT) and green (oxBS). F Number (y-axis, unit = million CpGs) of correctly classified (blue) by nanopore sequencing in a sample-to-sample comparison. Incorrectly classified CpGs are colored according to the absolute difference in 5-mCpG rates (color legend)

