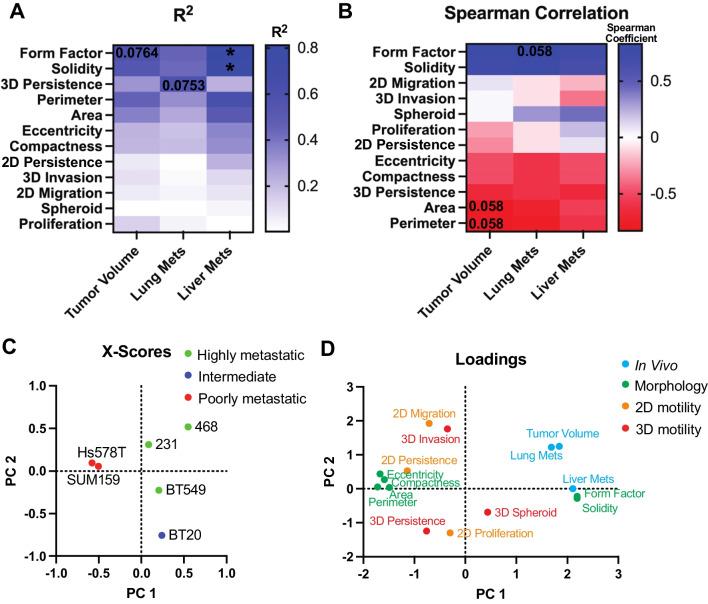
Fig. 7.
Distinct differences in cell line-specific behavior in vitro and in vivo. A pairwise analysis of the strength of the linear relationship (R2) between in vitro metrics and in vivo behavior. Numbers represent p-value and colors represent R2 value where blue is high and white is low indicated by gradient B Spearman correlation between in vitro metrics and in vivo behavior. Numbers represent p-value and colors represent the Spearman correlation coefficient where blue is a high positive correlation, white is no correlation and red is a negative correlation indicated by gradient C X-scores plot of the PLS model D PLS loadings for adhesion metrics, proliferation, 2D and 3D motility, and in vivo tumor volume, lung and liver metastases

