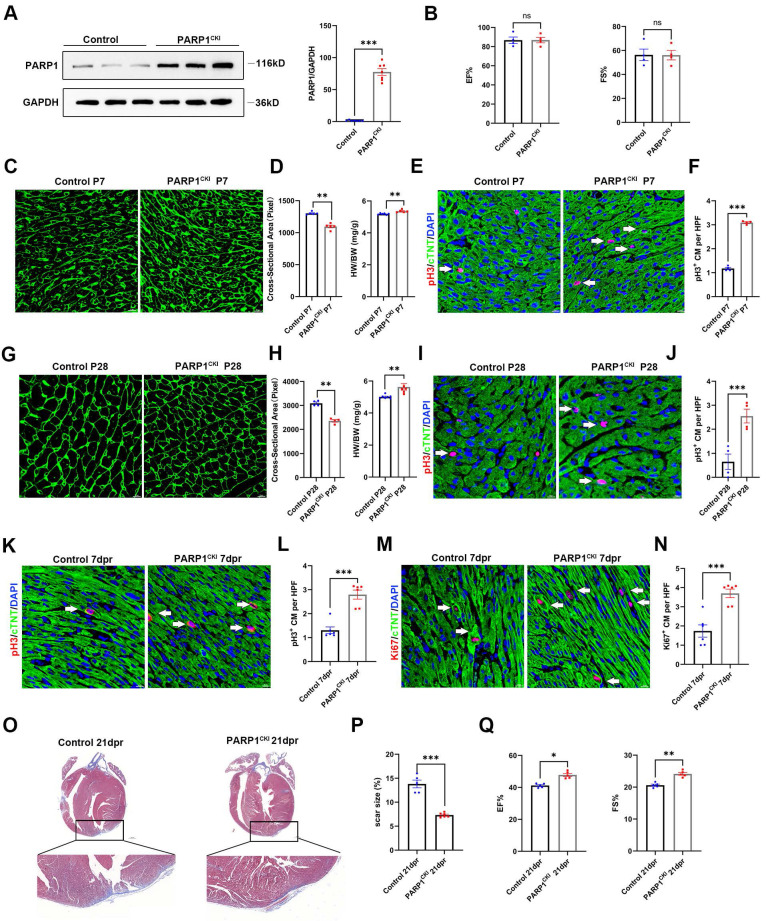
Figure 3.
PARP1 overexpression promotes heart regeneration in neonatal mice. (A) Representative western blot and statistical analysis of PARP1 protein expression in control mice and PARP1CKI mice. GAPDH was used as a loading control (n=7 per group). ***P < 0.001 by unpaired Student's t-test. (B) Statistical analysis of EF and FS of echocardiography at P28 in control mice and PARP1CKI mice (n=4 per group). (C and D) WGA staining and statistical analysis of WGA staining and HW/BW ratio in control mice and PARP1CKI mice at P7 (n=5-6 per group), **P < 0.01 by unpaired Student's t-test. (E and F) Representative immunostaining images and statistical analysis of pH3+ (red) cardiomyocyte number in control mice and PARP1CKI mice at P7 (n=4 per group). Scale bars, 10μm. ***P < 0.001 by unpaired Student's t-test. (G and H) WGA staining and statistical analysis of WGA staining and HW/BW ratio in control mice and PARP1CKI mice at P28 (n=4-7 per group). **P < 0.01 by unpaired Student's t-test. (I and J) Representative immunostaining images and statistical analysis of pH3+ (red) cardiomyocyte number in control mice and PARP1CKI mice at P28 (n=4 per group). Scale bars, 10μm. ***P < 0.001 by unpaired Student's t-test. (K and L) Representative immunostaining images and statistical analysis of pH3+ cardiomyocytes (red) in control mice and PARP1CKI mice at 7 dpr (n=6 per group). Scale bars, 10 μm. ***P < 0.001 by unpaired Student's t-test. (M and N) Representative immunostaining images and statistical analysis of Ki67+ cardiomyocytes (red) in control mice and PARP1CKI mice at 7 dpr (n=6 per group). Scale bars, 10 μm. ***P < 0.001 by unpaired Student's t-test. (O and P) Masson staining images and statistical analysis of heart regeneration and scar size in control mice and PARP1CKI mice (n=5-6 per group). Scale bars, 500 μm. ***P < 0.001 by unpaired Student's t-test. (Q) Statistical analysis of EF and FS of echocardiography in control mice and PARP1CKI mice at 21 dpr (n=5 per group), *P < 0.05, **P < 0.01 by unpaired Student's t-test.

