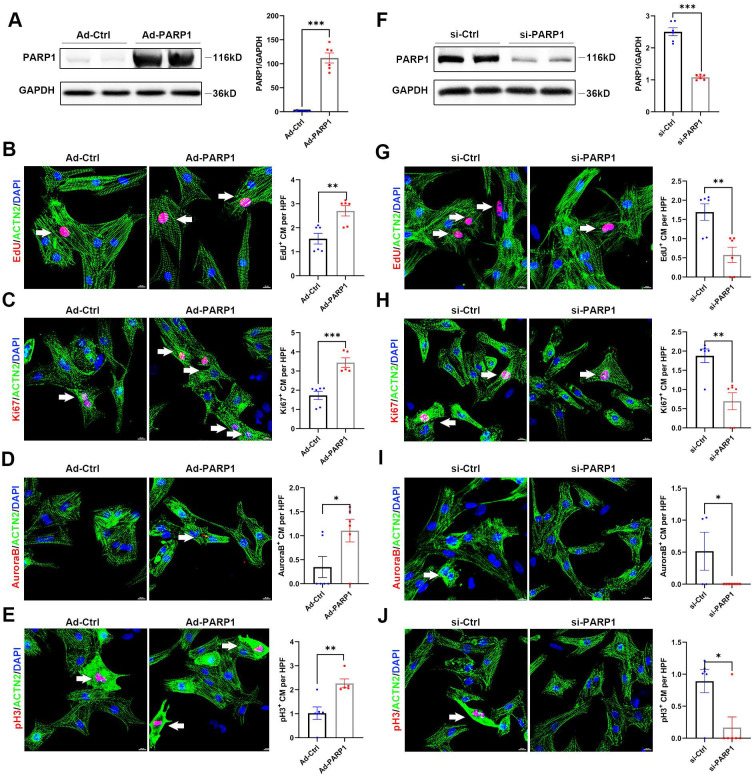
Figure 4.
PARP1 controls cardiomyocyte proliferation in vitro. (A) Representative western blot images and statistical analysis of PARP1 protein expression in NRCMs infected with Ad-Ctrl or Ad-PARP1. GAPDH was used as a loading control (n=6). ***P < 0.001 by unpaired Student's t-test. (B-E) Representative immunostaining images and statistical analysis of EdU+, Ki67+, Aurora B+, and pH3+ (red) cardiomyocyte number in Ad-Ctrl or Ad-PARP1 infected NRCMs (n=5-6). Scale bars, 10 μm. *P < 0.05, **P < 0.01, and ***P < 0.001 by unpaired Student's t-test. (F) Representative western blot images and statistical analysis of PARP1 protein expression in NRCMs transfected with si-Ctrl or si-PARP1. GAPDH was used as a loading control (n=6). ***P < 0.001 by unpaired Student's t-test. (G-J) Representative immunostaining images and statistical analysis of EdU+, Ki67+, Aurora B+, and pH3+(red) cardiomyocyte number in si-Ctrl or si-PARP1 transfected NRCMs (n=5-7). Scale bars, 10 μm. *P < 0.05, **P < 0.01, and ***P < 0.001 by unpaired Student's t-test.

