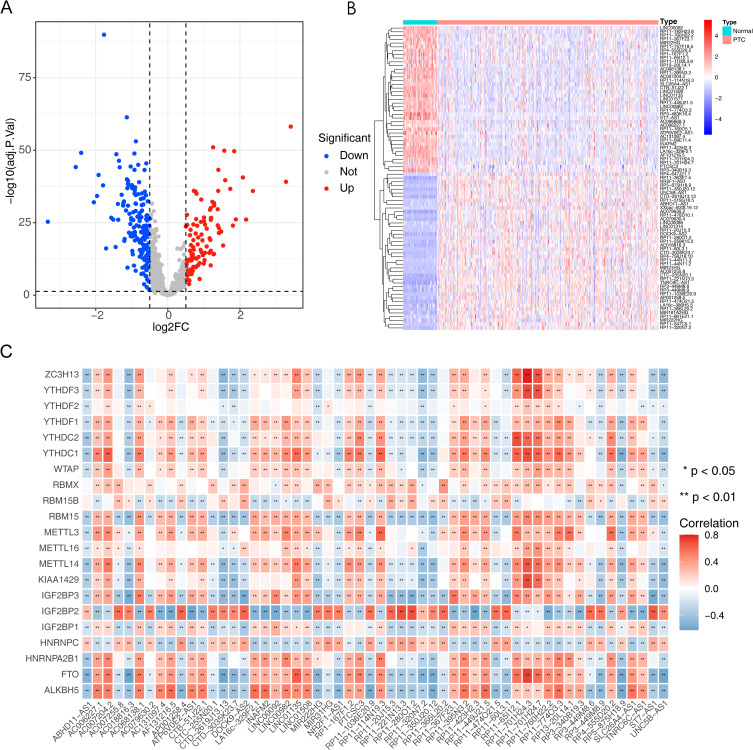
Figure 1.
Identifying of differentially expressed lncRNAs (DELs) between normal tissues and PTC. (A) Volcano plot of DELs in normal tissues and PTC (|Log2FC| > 1 and adj. P value < 0.05), with red dots representing up-regulation, blue dots representing down-regulation and grey dots representing genes that are not significantly different. (B) Heatmap of lncRNAs differentially expressed between normal tissues and PTC. (C) Heat map of the correlation between m6A methylation regulators and DELs.

