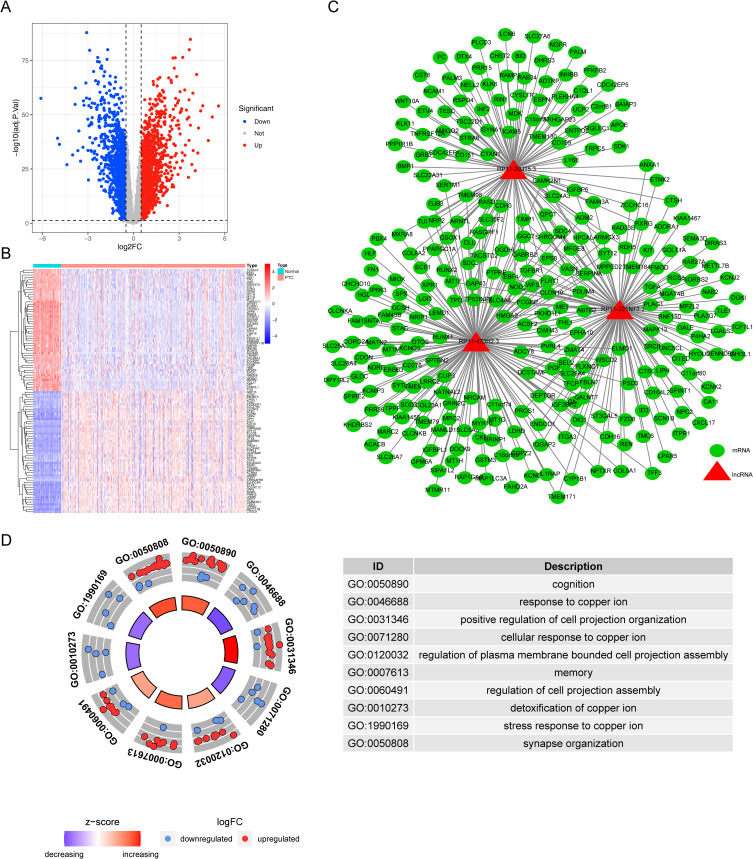
Figure 8.
Expression of differentially expressed genes (DEGs) between normal tissues and PTC and construction of lncRNA-mRNA co-expression network. (A) Volcano plot of DEGs in normal tissue and PTC. (B) Heatmap of all genes differentially expressed between normal tissues and PTC. (C) PTC-related lncRNA-mRNA co-expression network signal network. (D) LncRNAs co-expressing genes enrichment to TOP10 GO map.

