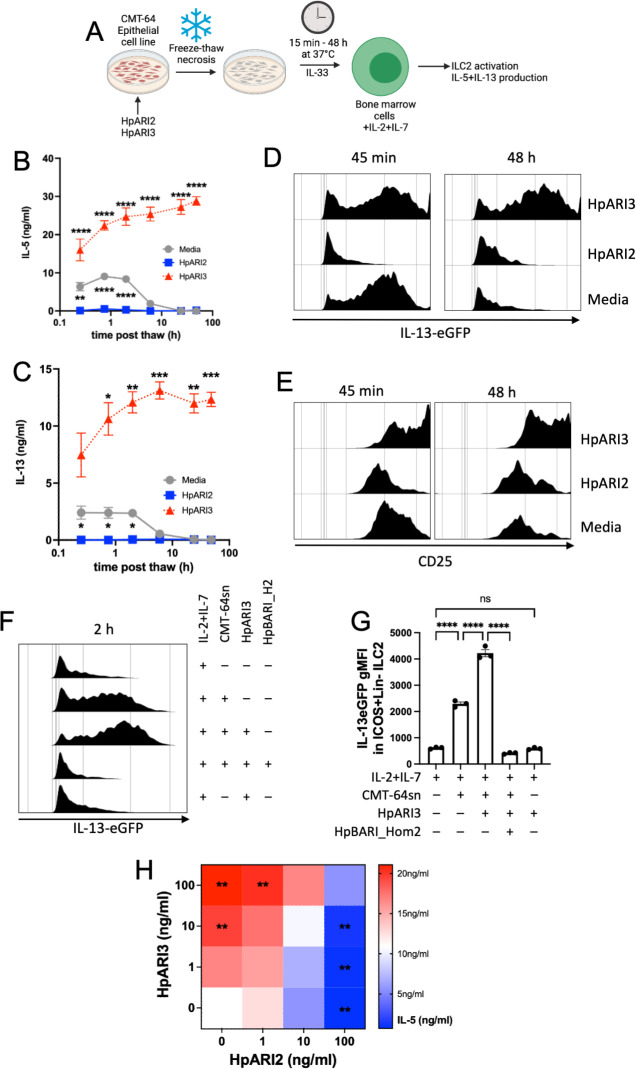
Fig 5.
HpARI3 stabilizes IL-33 in its active form. (A) Experimental setup for B to G. Supernatants were taken over a timecourse after freeze-thawing of CMT-64 cells in the presence of HpARI2 or HpARI3, transferred to IL-13eGFP+/– bone marrow cells with IL-2 + IL-7, and cultured for 5 days. HpARI2 and HpARI3 were applied to CMT-64 cells at 10 µg/mL, then 50 µL of supernatants was added to a 200-µL bone marrow culture to give a final concentration of 2.5 µg/mL. Created with BioRender.com. (B) IL-5 levels in supernatants from cultures as shown in A, measured by ELISA. (C) IL-13 levels in supernatants from cultures as shown in A, measured by ELISA. (D) IL-13eGFP expression in gated ICOS+Lin–CD45+ ILC2s from cultures as shown in A, measured by flow cytometry. (E) CD25 expression in gated ICOS+Lin–CD45+ ILC2s from cultures as shown in A, measured by flow cytometry. Data from B to E representative of three repeat experiments. Error bar shows SEM of four technical replicates. Analyzed by a two-way ANOVA with Dunnett’s posttest. (F) HpARI3 (100 ng/mL) and HpBARI_Hom2 (1,000 ng/mL) were applied to CMT-64 cells, prior to freeze-thaw, incubation at 37℃ for 2 h, and transfer to cultures of bone marrow cells with IL-2 + IL-7 (or IL-2 + IL-7 alone), and cultured for 5 days. IL-13eGFP expression in gated ICOS+Lin–CD45+ ILC2s was assessed by flow cytometry. Representative histograms are shown. (G) Geometric mean fluorescence intensity of IL-13eGFP in ICOS+Lin–CD45+ ILC2s described in F. (H) HpARI2 and HpARI3 at a range of concentrations were applied to CMT-64 cells, prior to freeze-thaw, incubation at 37℃ for 2 h, and transfer to cultures of bone marrow cells with IL-2 + IL-7, and cultured for 5 days. Levels of IL-5 in supernatants were measured by ELISA. Mean of three independent biological replicates. Statistical significance is shown as compared to the medium-only control. Analyzed by one-way ANOVA with Dunnett’s posttest.

