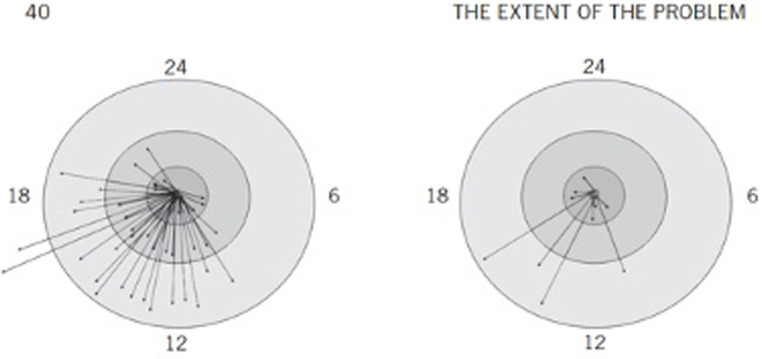
Figure 1.
Case comparison of positive relational interactions used with permission of Guilford Publications, from Ludy-Dobson and Perry (2010) permission conveyed through Copyright Clearance Center, Inc. Positive relational interactions: Typical and foster child. These two figures are representative 24-hour relational contact maps examining the number of positive relational interactions in two children. Arrows represent positive interactions (as rated by observer and child); arrows ending in the inner circle represent interactions with family; additional circles represent friends, then classmates/acquaintances. Arrows outside the circle represent interactions with strangers. The figure on the right is based on a 10-year-old boy in foster care who was moved in the middle of the school year to a new foster home away from extended family and community. This figure is the best 24-hour map for a 2-week period for this child. Several days were completely devoid of any positive relational interaction. The relational poverty played a major role in this child’s inability to progress; symptoms related to trauma and neglect persisted and increased while he was in relationally impoverished settings. Once in a stable placement with positive relationships created in school and the community, he stabilized and improved.

