
Figure 1.
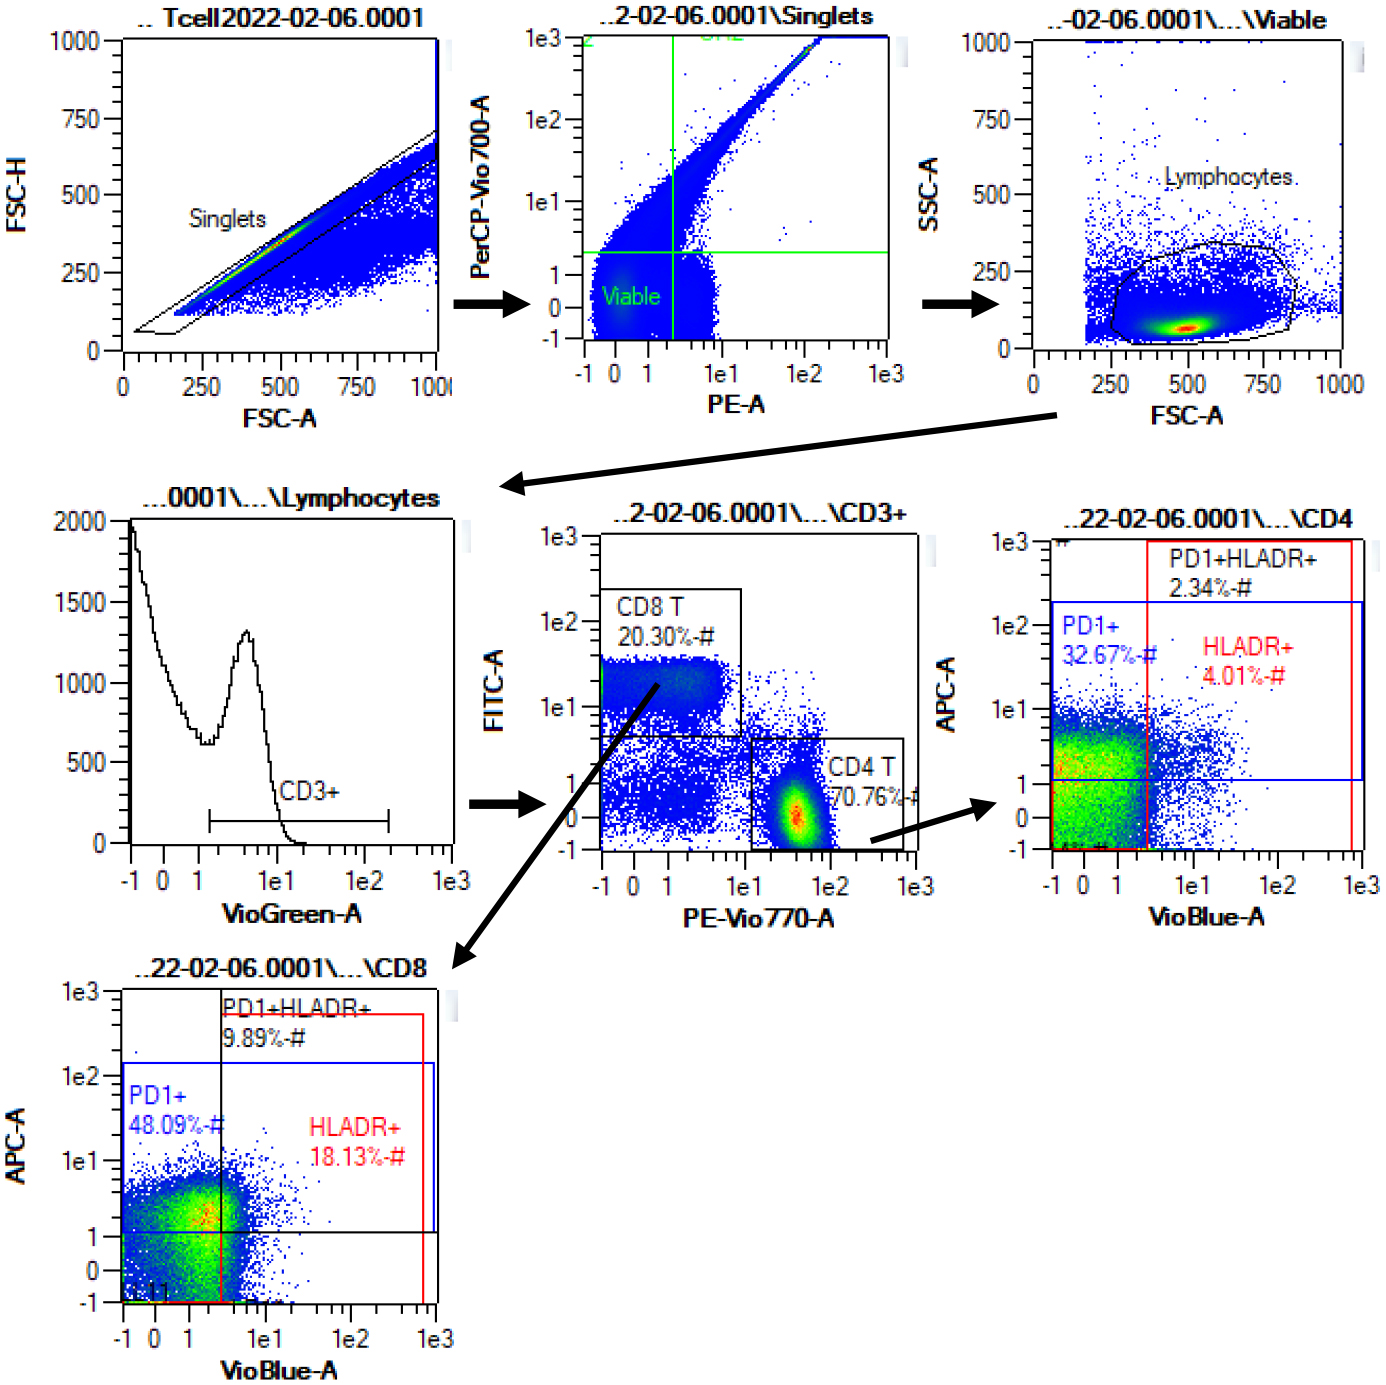
Representative flow cytometry data to illustrate gating strategy. Plots demonstrate sequential gating of singlets, viable (propidium iodide negative) cells, lymphocytes, T cells (CD3+), CD4+ and CD8+ T cells, and selection of HLA-DR+, PD-1+, and HLA-DR+PD-1+ subsets within CD4+ and CD8+ T cells. HLA-DR and PD-1 gates were set using fluorescence minus one controls.