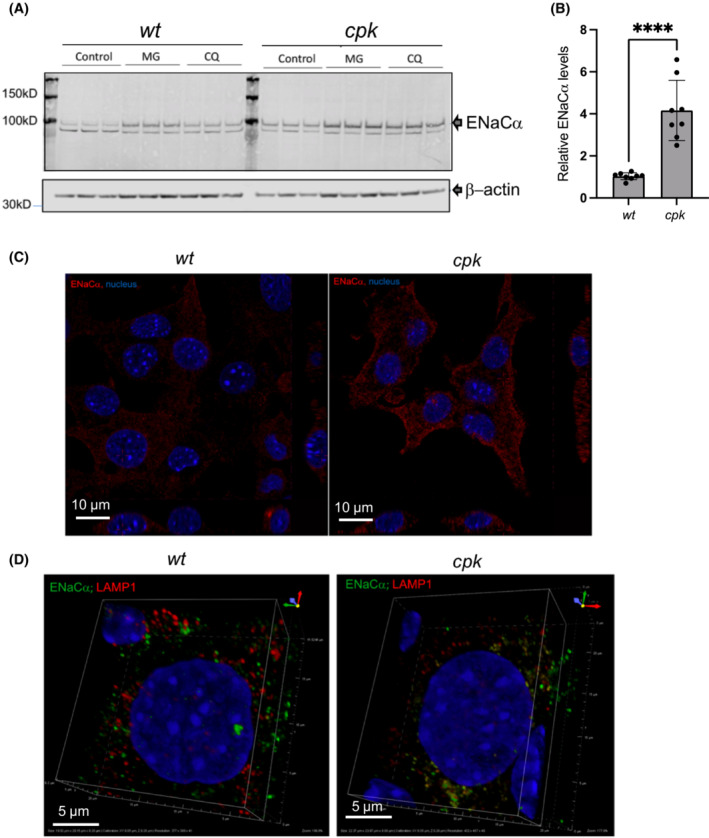
FIGURE 8.

Higher ENaC levels in cpk cells. (A) Representative WB of ENaCα in wt and cpk cells. β‐actin was used as loading control. Both proteasome and lysosome inhibition (CQ) enhanced ENaCα levels, consistent with previously reported results. (B) Relative ENaCα levels. (N = 3, n = 7; ***p < .0001). (C) Increased ENaC staining (red) in cpk cells. Confocal microscopy images of wt (left) and cpk cells (right). (D) Co‐localization of ENaC and LAMP1 (lysosomal marker). Minimal co‐localization of ENaC (green) with LAMP1(red) in wt cells (left). ENaC (green) highly co‐localized with LAMP1 (red) in cpk cells (right).
