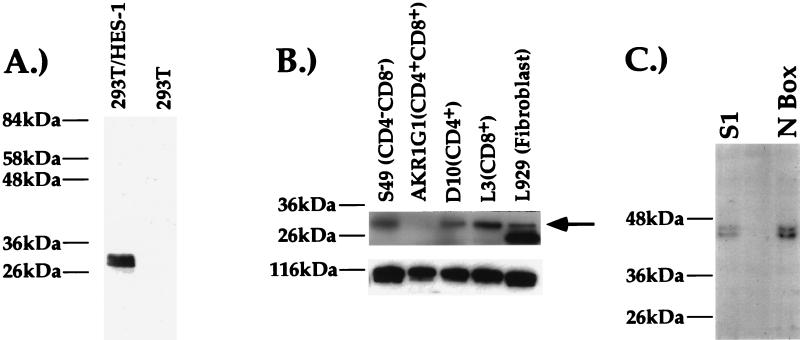
FIG. 4.
Western blot and UV cross-linking–immunoprecipitation analyses with the anti-HES-1 antiserum (31). Positions of protein molecular mass markers are indicated to the left of the blot. (A) Western blot analysis on nuclear extracts from 293T cells transfected with the CMV-HES-1 antiserum (left lane) or mock-transfected 293T cells. At much longer exposures we can detect endogenous HES-1 expression in the mock-transfected cells (data not shown). (B) Western analyses on nuclear extracts purified from different cell lines. The nitrocellulose blot probed with the anti-HES-1 antiserum (top) and the same blot probed with an antiserum against the transcription factor sp3 as a loading control (bottom) are shown. Molecular mass markers are indicated. On longer exposure, the HES-1 band in the AKR1G1 cell line is more evident. The arrow indicates HES-1 band. (C) UV-cross-link–immunoprecipitations with the anti-HES-1 antiserum and the S1 probe or the N-box probe. These experiments were conducted with the CD8 SP L3 TC clone; similar results were obtained with the CD4 SP D10 TH clone (data not shown).

