Figure 4.
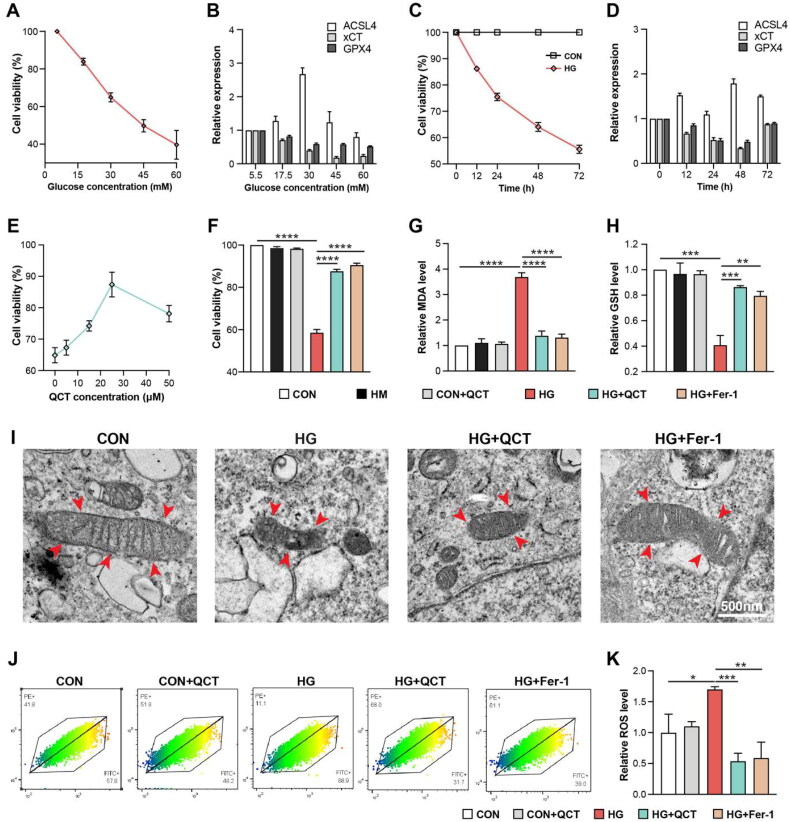
Quercetin mitigates high glucose-induced damage in renal tubular epithelial cells. (A) HK-2 cell viability across various glucose concentrations (5.5 mM, 17.5 mM, 30 mM, 45 mM and 60 mM) assessed via CCK-8 assay. (B) The mRNA expression levels of ACSL4, GPX4, and xCT in HK-2 cells after treatment with varying glucose concentrations in Figure 4A. (C) Viability of HK-2 cells in high-glucose (HG, 30 mM) and control (CON, 5.5 mM) conditions over different incubation time points (0, 12h, 24h, 48h, 72h) measured by CCK-8 assay. (D) The mRNA expression levels of ACSL4, GPX4, and xCT in HK-2 cells exposed to high-glucose (30 mM) and control (CON, 5.5 mM) conditions over different incubation time in Figure 4C. (E) CCK-8 assay determining HK-2 cell viability post-quercetin treatment at different doses (0, 5 μM, 15 μM, 25 μM, 50 μM). (F) Cell viability comparison among HK-2 cells groups via CCK-8 assay. The MDA (G) and GSH (H) levels in HK-2 cells groups quantified using biochemical assays. (I) Transmission electron microscopy (TEM) used to observe mitochondrial ultrastructural changes in HK-2 cells (scale bar = 500 nm), with mitochondria indicated by red arrows. (J) Flow cytometry (FACS) quantification of reactive oxygen species (ROS) levels in HK-2 cell groups. (K) The ROS expression level in Figure 4(J). CON: control HK-2 cells; HM: control HK-2 cells receiving mannitol treatment; CON + QCT: control HK-2 cells receiving quercetin treatment; HM: HG: HK-2 cells under high-glucose (HG); HG + QCT: HK-2 cells under HG incubation receiving quercetin treatment; HG + Fer-1: HK-2 cells under HG incubation receiving Fer-1 treatment. Data are mean ± SD. Significance levels are indicated as follows: ****p < 0.0001; ***p < 0.001; **p < 0.01; *p < 0.05, determined by one-way ANOVA.

