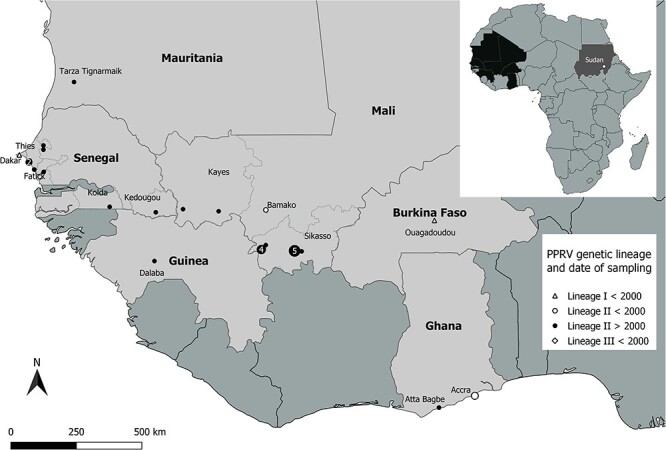
Figure 1.

Map of the geographical location of PPRV samples sequenced in this study. The small map in the upper right corner indicates the countries sampled in Africa and the position of the sample collected in Sudan. The sample from India is not represented. Samples belonging to PPRV genetic LI are represented by a triangle, LII by a circle, and LIII by a diamond (in the small map). The symbols used differentiate historical samples (date <2000) from recent samples. Numbers within the symbols indicate the number of samples sequenced, if there is more than one per location.
